值得关注的趋势
Talking Tariffs
- U.S.-China Tariff Developments: In an October 10 Truth Social post, President Trump stated that he intends to impose a 100% tariff on China beginning November 1, “over and above any tariff that they are currently paying.” President Trump also indicated plans to impose export controls on critical software. These measures await official confirmation via executive order or Federal Register notice.
- Just two days after his initial post, President Trump appeared to soften his stance in a follow-up Truth Social post: “Don’t worry about China … Highly respected President Xi just had a bad moment.”
- At an October 15 news conference, U.S. Treasury Secretary Scott Bessent suggested a potential extension of the 90-day U.S.-China tariff truce, which is set to expire on November 10. If President Trump proceeds with implementing a 100% tariff on China on November 1, however, the two nations will face a tighter timeline for reaching an agreement. According to Bessent, a deciding factor is whether China delays or scraps upcoming export controls on rare earth metals, which remain a long-standing point of contention in U.S.-China trade talks.
- It is currently unclear whether President Trump and President Xi will meet as planned at South Korea’s Asia-Pacific Economic Cooperation (APEC) Forum at the end of October. While President Trump stated on October 10 that “there seems to be no reason” to proceed with the meeting, Bessent indicated a few days later that these plans are still in place.
- According to a recent U.S. Trade Representative (USTR) notice, the U.S. will impose a 100% duty on certain Chinese ship-to-shore cranes and cargo handling equipment on November 9.
- U.S.-China Vessel Fee Developments: On October 14, the U.S. implemented port fees on Chinese-built and Chinese-operated vessels. On the same day, China implemented countermeasures on American vessels calling at Chinese ports.
- Chinese vessel owners and operators calling at a U.S. port now face a fee of $50 per net ton, while Chinese-built ships are subject to the greater of an $18 per net ton fee or a $120 per container fee. These fees will increase over time, in line with a set schedule. Check out our blog for more, including scheduled fee increases and potential exemptions.
- Per USTR guidance, the burden is on the vessel operator—not U.S. Customs and Border Protection (CBP)—to determine whether their vessel owes a fee. The USTR also indicated that vessels subject to fee modifications, including Liquified Gas Carriers and roll-on/roll-off vessels, may defer fee payments until December 10.
- Chinese countermeasures: Any vessel owned, operated, or built in the U.S. faces a fee of CN¥400 (~$56) per net ton when berthing at a Chinese port. These retaliatory fees are set to increase in line with the U.S.’s fee schedule.
- U.S. Government Shutdown Developments: The shutdown recently entered its third week. CBP has confirmed on trade calls that the flow of cargo and passengers continues as normal, and CBP’s budget and staff are unaffected by the shutdown. CBP has confirmed that it will not issue any refunds during the shutdown, including any ACH or check refunds, drawback claim payments, protests, post-summary corrections, or any other payment involving a check from the Treasury Department. For the latest shutdown impacts on CBP and other federal agencies, check out our blog.
- Other Recent Updates:
- A series of new duties took effect on October 14: 10% on softwood timber and lumber, 25% on certain upholstered furniture (except for a 15% cap on the EU and Japan and a 10% cap on the U.K.), and 25% on certain kitchen cabinets and bathroom vanities (except for a 15% cap on the EU and Japan and a 10% cap on the U.K.). On January 1, 2026, countries without a trade agreement in place with the U.S. will see cabinet and vanity tariffs increase to 50%, and upholstered furniture tariffs to 30%.
- On October 14, President Trump suggested potential new tariffs on Spain, citing its refusal to comply with the 5%-of-GDP defense spending target for NATO members. A day later, the European Commission indicated that the EU will “respond appropriately … to any measures taken against one or more of our member states.”
- Find the latest tariff and trade developments on our live blog.
Calculate your tariff and landed cost impacts in real time with the Flexport Tariff Simulator.
Ocean
TRANS-PACIFIC EASTBOUND (TPEB)
- Capacity and Demand:
- Capacity is holding at 60-70% through the end of October, and is scheduled to recover to over 80% for November.
- Overall, demand remains flat. Carriers are monitoring the response to the recently proposed tariffs on China, but have yet to observe any changes to booking profiles.
- Freight Rates:
- Carriers have announced an October 15 General Rate Increase (GRI). Early indications are that the GRI is holding.
- Carriers have postponed the PSS (Peak Season Surcharge) to November, given flat demand and the overall market outlook.
- The first Shanghai Containerized Freight Index (SCFI) update after Golden Week showed a slight upward movement, signaling a potential market turnaround.
FAR EAST WESTBOUND (FEWB)
- Capacity and Demand:
- The post-Golden-Week capacity void remains moderate, with a ~10% weekly capacity cut through Week 44.
- Rolled shipments due to blank sailings from the Golden Week period are taking up sailing space for the second half of October.
- Congestion in Antwerp and Rotterdam, especially at the Rotterdam World Gateway terminal under the Premier Alliance, has led to berth wait times exceeding 300 hours. Strikes in Belgium and the Netherlands may worsen congestion in the coming weeks.
- Demand after Golden Week is recovering slowly. Carriers plan to tighten allocation management from late October to November.
- Strike Impacts:
- Belgium: On October 6, maritime pilots at Belgium’s major ports—Antwerp, Zeebrugge, and Ghent—launched a strike to protest federal pension reforms. The strike has been temporarily suspended until October 24.
- Netherlands: On October 8, lashers at the Port of Rotterdam went on strike, demanding a 6.5% wage increase and inflation compensation. A court ruling required workers to halt the strike on weekdays, with partial port operations estimated to resume on October 17. However, it may take until the end of October to clear the cargo backlog.
- Overall impact: The strikes across Belgium and the Netherlands have put pressure on Europe’s main trade corridors. Supply chain delays are affecting Germany, France, and Central Europe, increasing costs and extending transit times. Despite temporary strike suspensions, port congestion and scheduling delays continue. It will likely take several weeks for transport operations to normalize.
- Freight Rates:
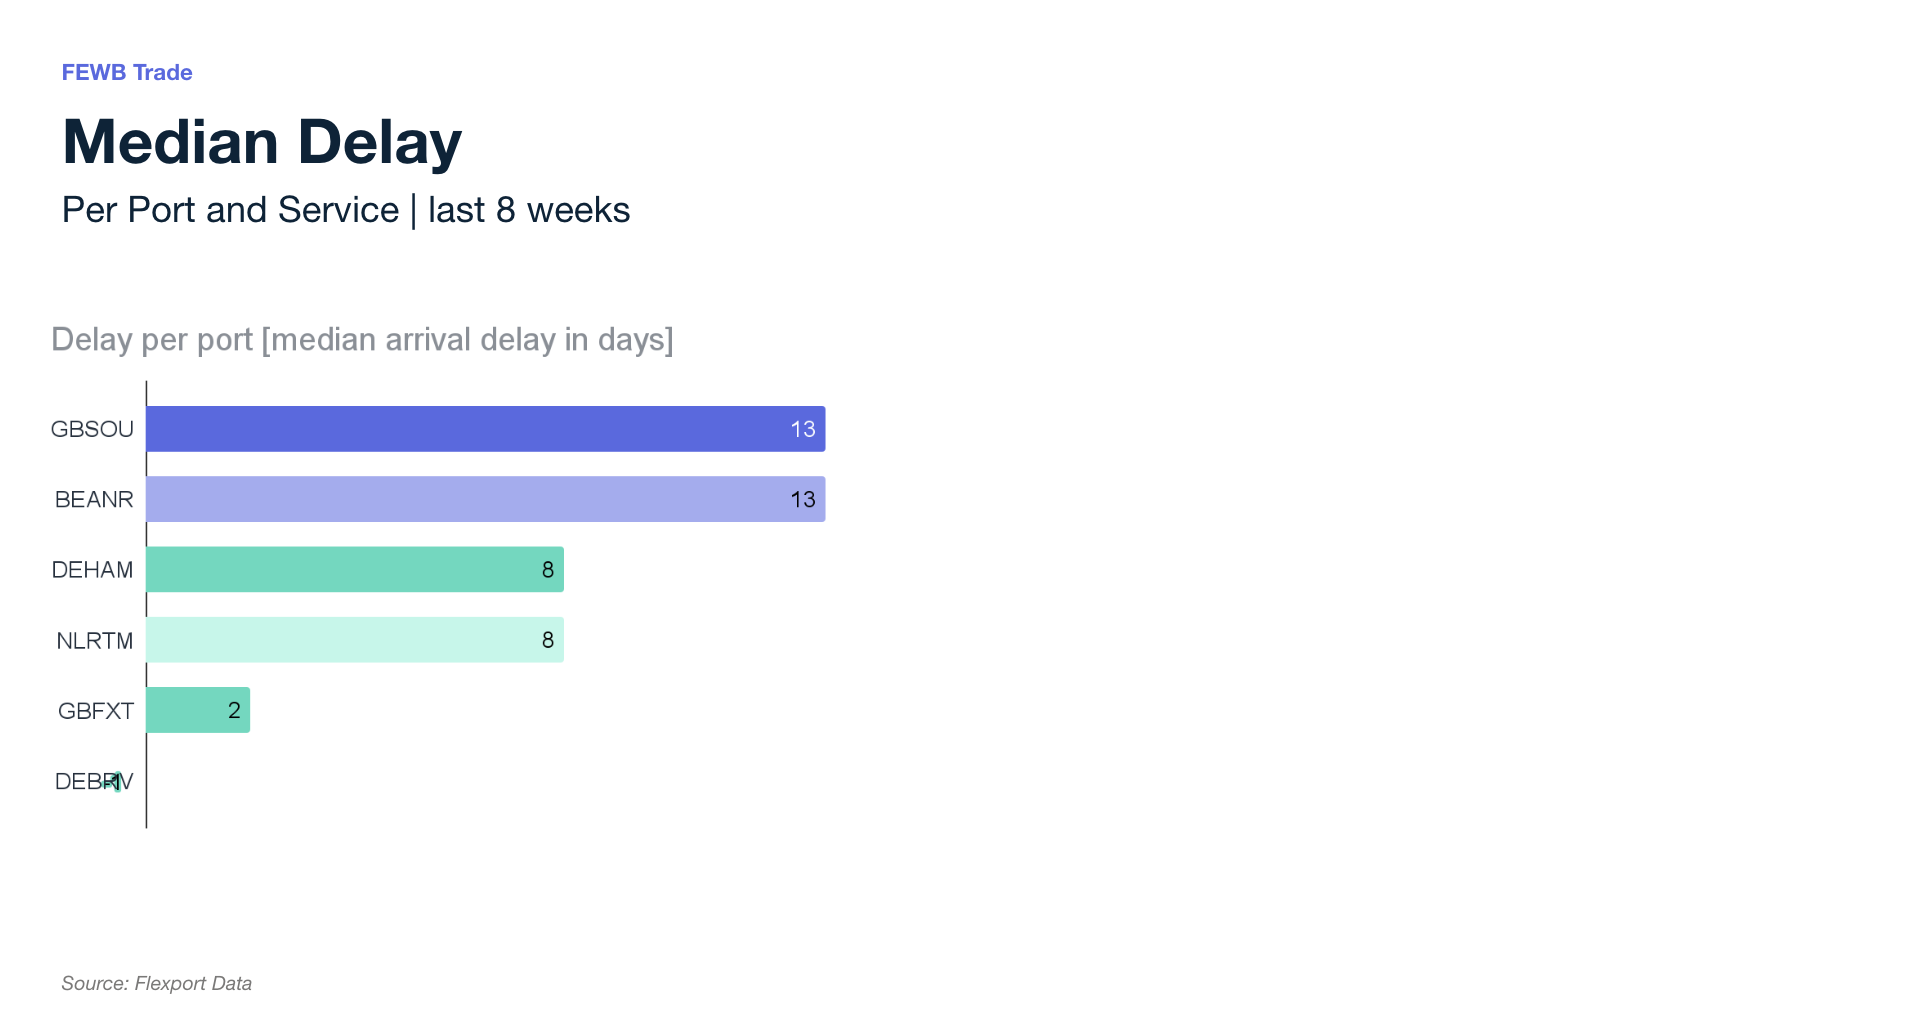
- The first Shanghai Containerized Freight Index (SCFI) update after Golden Week showed a slight upward movement, signaling a potential market turnaround.
- Major carriers have raised their Freight All Kinds (FAK) rates for the second half of October and officially announced General Rate Increases (GRIs) for November.
- Ongoing congestion at destination ports may affect vessel turnaround efficiency, potentially leading to more blank sailings and equipment shortages in early November. These operational factors are likely driving carriers to implement their planned rate increases for November.
TRANS-ATLANTIC WESTBOUND (TAWB)
- Capacity and Demand:
- Antwerp: The pilots’ strike has been temporarily suspended. Yard utilization is at 90%, with berth delays of two to four days.
- Rotterdam: A recent port lasher strike has disrupted container operations. Yard utilization is at 70-83%, with berth delays of two to eight days.
- Hamburg: Yard utilization is at 75%, with berth delays of five to seven days.
- Bremerhaven: Yard utilization is at 75-85%, with berth delays of one to three days.
- South Mediterranean (Piraeus, Genoa, Valencia): Significant yard congestion persists. Vessel wait times remain at three to seven days.
- Equipment:
- Equipment challenges in Europe this month persist, with ongoing container and chassis shortages concentrated in Austria, Slovakia, Hungary, Southern and Eastern Germany, and Portugal. These shortages are contributing to ongoing operational challenges.
- Freight Rates:
- As of October 13, spot rates remain subdued, hovering around $1,800 to $1,900/FEU. This reflects an ongoing environment of soft demand and moderate vessel and equipment availability on the route.
INDIAN SUBCONTINENT TO NORTH AMERICA
- Capacity and Demand:
- In general, routes from the Indian subcontinent to the U.S. remain status quo compared to previous weeks. The India-specific tariff escalation in August continues to keep demand soft, and we continue to see capacity management as a result.
- Capacity to the U.S. East Coast: Supply continues to outstrip demand, resulting in blank sailings throughout the month of October.
- Capacity to the U.S. West Coast: Capacity remains widely available, given oversupply on the TPEB into the U.S. West Coast. Capacity management is increasing as services that connect to the U.S. remain soft across Asia.
- Freight Rates:
- Cargo moving to the U.S. East Coast: Market rate levels continue to hold steady. Carriers are continuing to enact capacity management strategies, driving more balanced supply in the market.
- Cargo moving to the U.S. West Coast: Recent tariff increases and oversupply on core TPEB lanes continue to keep rate levels low.
空运
- North China:
- The China-U.S. air freight market remains under significant pressure, with no indications that it will ease in the near term. Despite earlier expectations for post-holiday stabilization, capacity remains constrained as strong demand from the technology and ecommerce sectors absorbs nearly all available space. Current conditions are expected to persist in the coming weeks.
- Space availability remains limited across major U.S. gateways. West Coast destinations continue to see steady volumes, with rates likely to hold firm or edge higher. On the East Coast, demand continues to outpace supply, resulting in more pronounced capacity challenges and driving further upward pressure on rates. These constraints are unlikely to improve in the short term.
- Recent discussions surrounding potential new U.S. tariffs on Chinese imports are further straining the already-limited market and driving a short-term surge in demand. Even though implementation remains uncertain, the announcement has prompted many importers to expedite shipments to secure space ahead of the proposed implementation date of November 1.
- Overall, market conditions are expected to remain firm through late October. Elevated demand and restricted capacity are likely to keep rates high until additional lift becomes available or shipment volumes ease. Shippers are encouraged to plan ahead, book early, and remain flexible with routings to minimize potential disruptions.
- South China:
- Following the conclusion of China’s Golden Week, overall market capacity has largely returned to normal as carriers resume regular flight schedules. Despite this stabilization, recent U.S.-China tariff developments have driven a sharp increase in air freight rates. Demand from the ecommerce sector remains particularly strong, and continues to take up a significant share of available capacity.
- As a result, the market is experiencing heightened booking activity throughout October, placing continued pressure on available space. Shippers are encouraged to plan ahead and secure bookings at least five days in advance to ensure access to capacity and mitigate potential rate fluctuations.
- Vietnam:
- Market demand has strengthened following the end of Golden Week, with several carriers reporting full bookings from key origin points through mid-October.
- Capacity on major Trans-Pacific routes remains constrained, particularly on services to primary North American gateways. Tight space conditions are expected to persist in the near term as strong demand continues to exceed available capacity.
- South Korea:
- Air freight demand from South Korea rose sharply ahead of the recent national holiday, putting temporary pressure on Trans-Pacific lanes. Market conditions are expected to normalize by mid-October as operations stabilize.
- The FEWB market remains generally negotiable on rates, although capacity to certain European destinations is currently limited.
- Malaysia:
- Outbound volumes from Malaysia have continued to increase since the end of September. However, demand on Trans-Pacific routes has shown signs of easing, with carriers reporting moderate booking activity for early October.
- Capacity on the FEWB lane remains under pressure. On routes to key European gateways in particular, we expect limited space through the third week of October.
- To avoid potential delays, shippers are encouraged to secure bookings at least seven days in advance.
- Indonesia:
- Air freight markets ex-Indonesia remain stable, with consistent service levels and steady rates across major routes. Trans-Pacific lanes continue to perform reliably, while congestion at transshipment hubs is driving some space constraints on FEWB lanes.
- Exporters are advised to place bookings approximately seven days in advance to ensure capacity access to key European destinations.
- Thailand:
- Air freight demand from Bangkok continues to show a gradual increase, resulting in tighter capacity on key routes to major destinations in the United States and Europe. While rate levels remain stable compared to the previous week, growing local demand is putting additional pressure on available space.
- Given increasingly limited capacity on these primary trade lanes, shippers are encouraged to plan shipments early—ideally five to seven days in advance—to secure uplift and minimize the risk of delays.
(Source: Flexport)
请与您的客户代表联系,了解货运所受影响的详情。
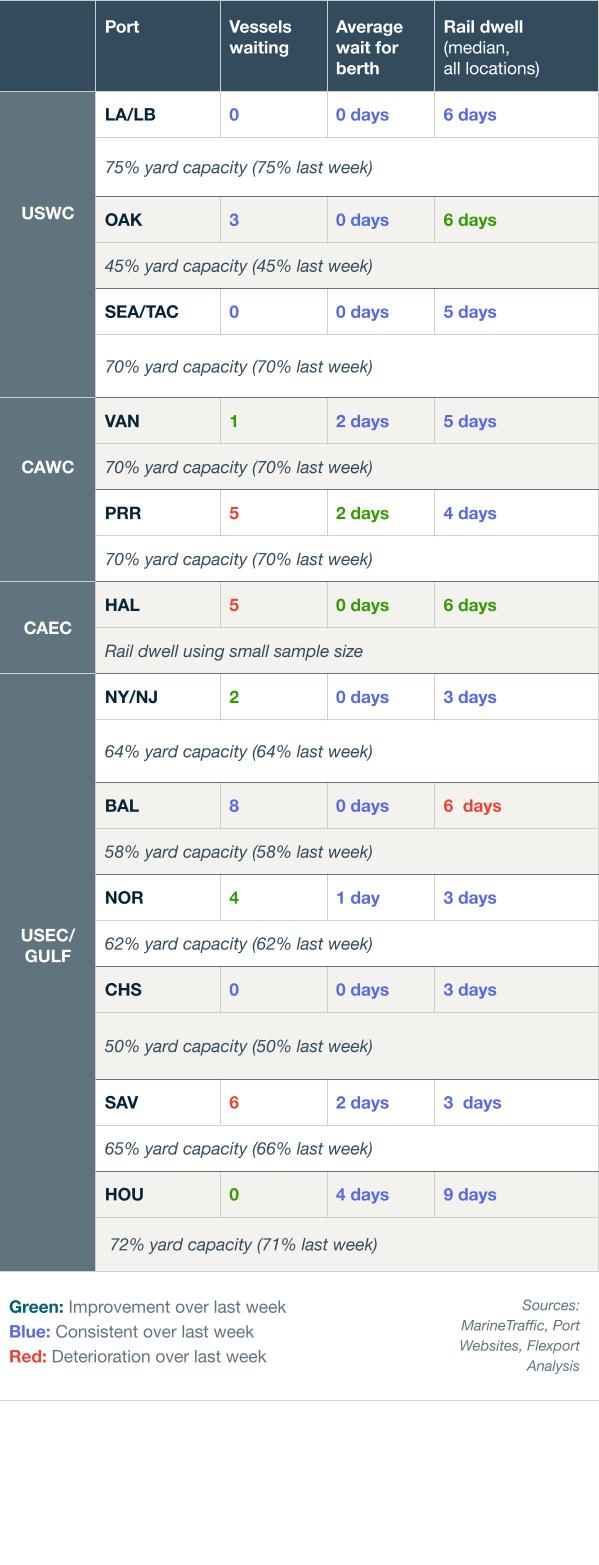
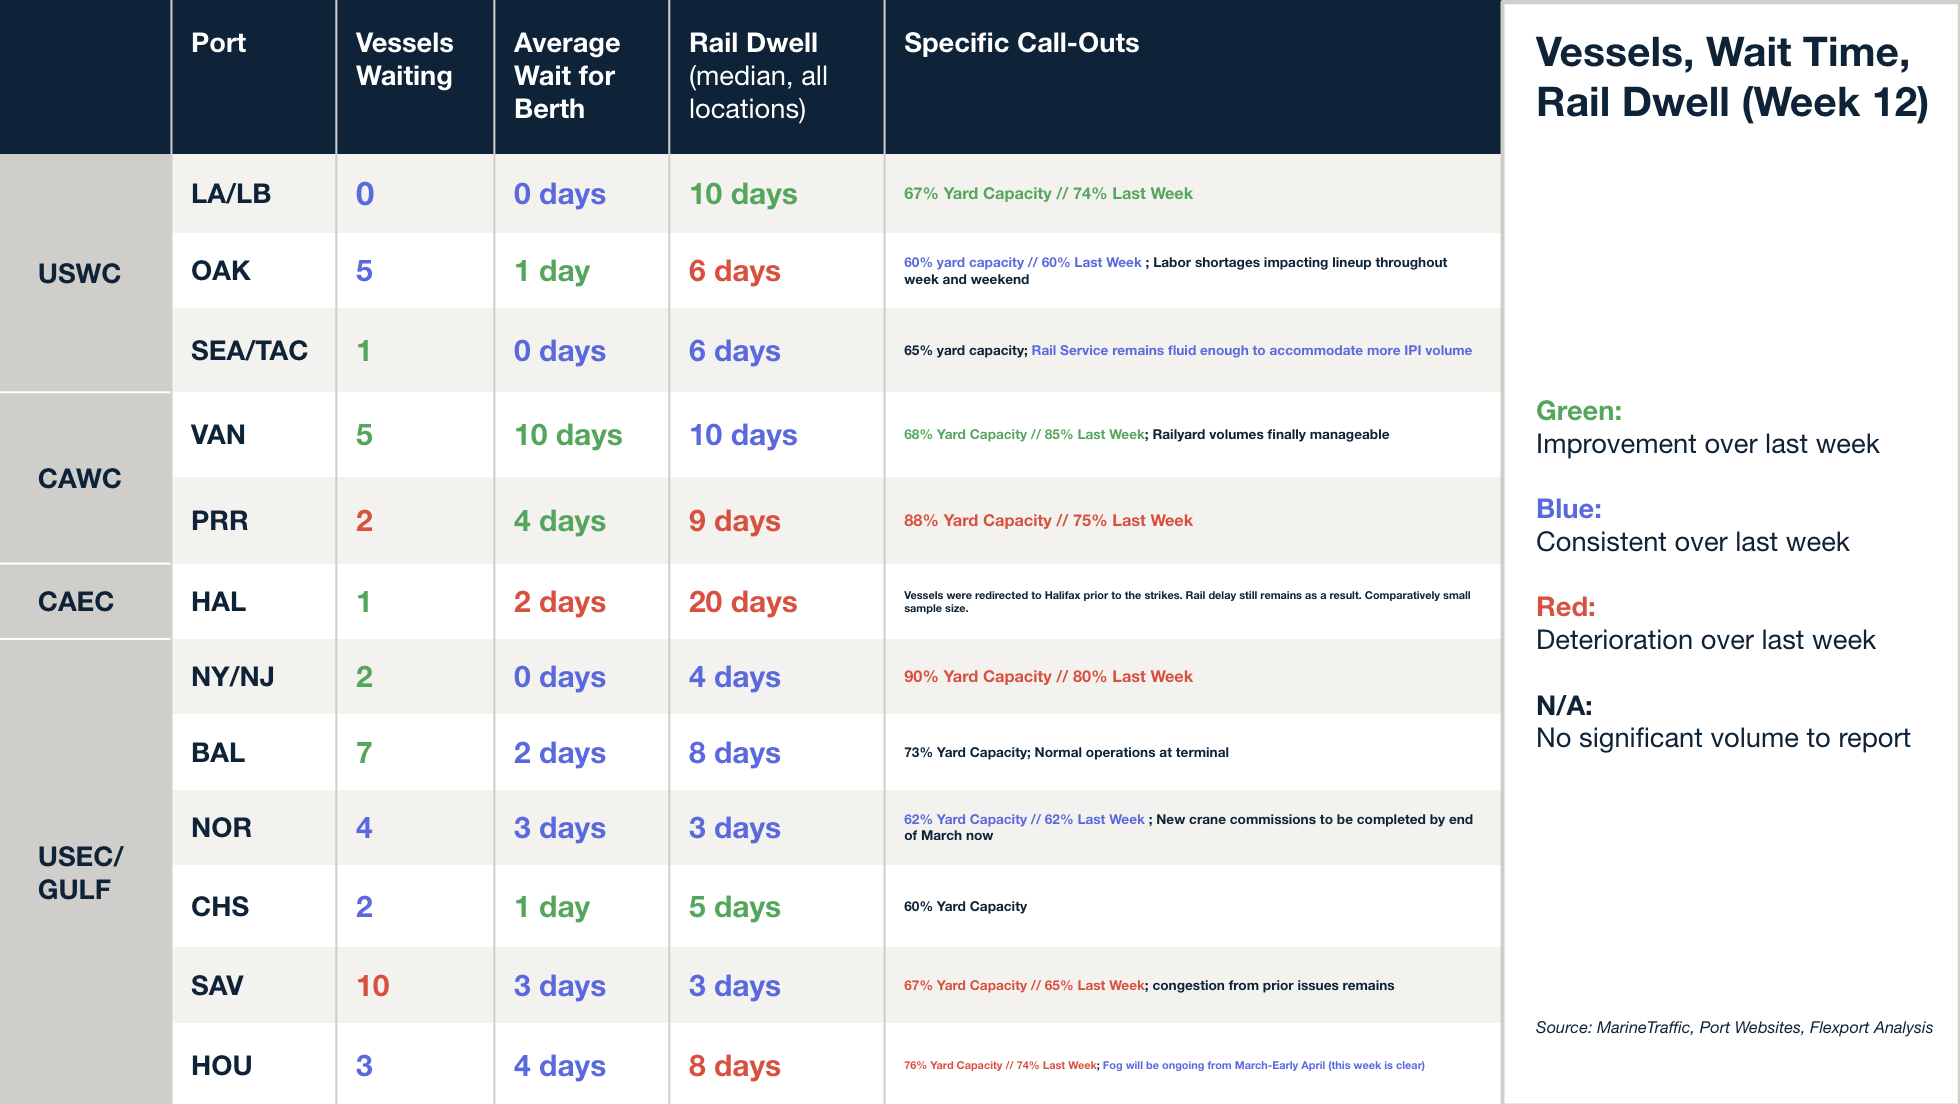
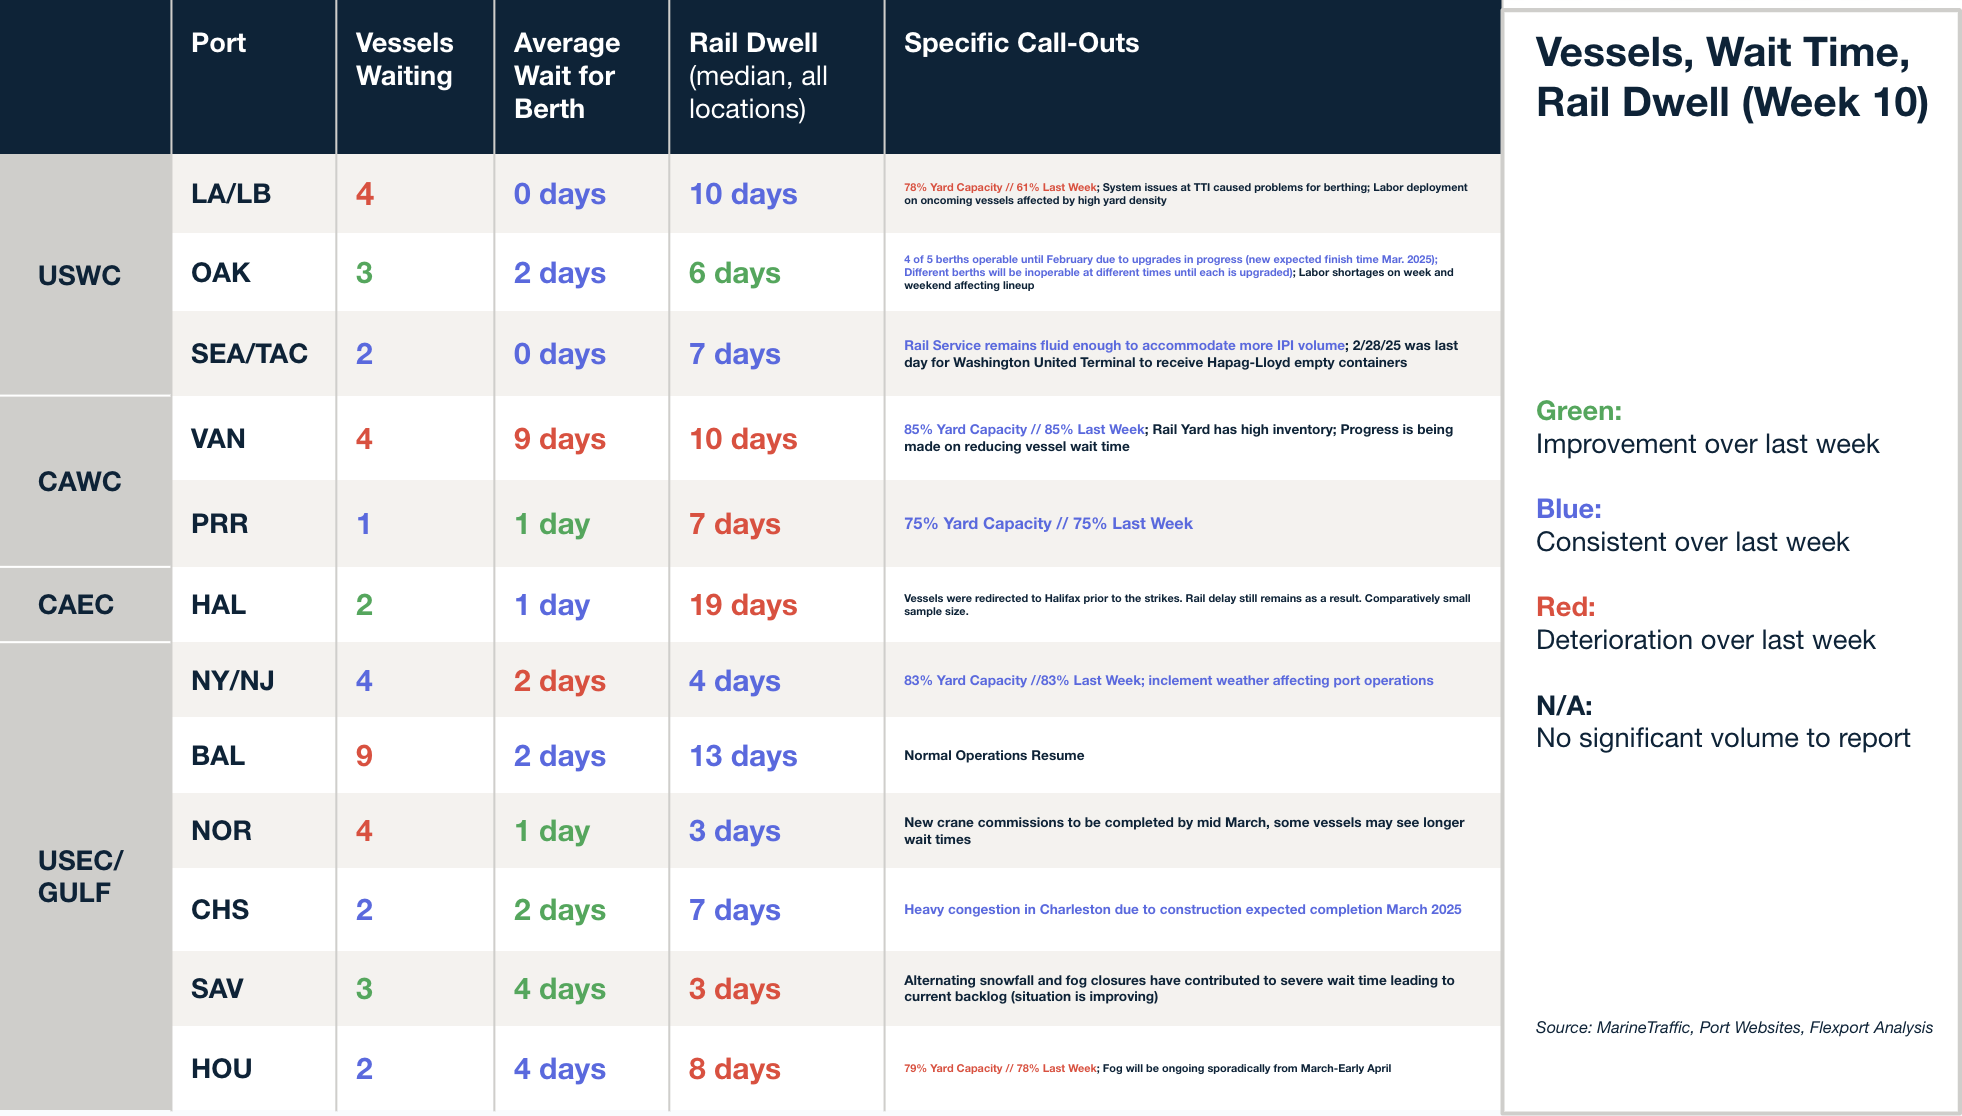
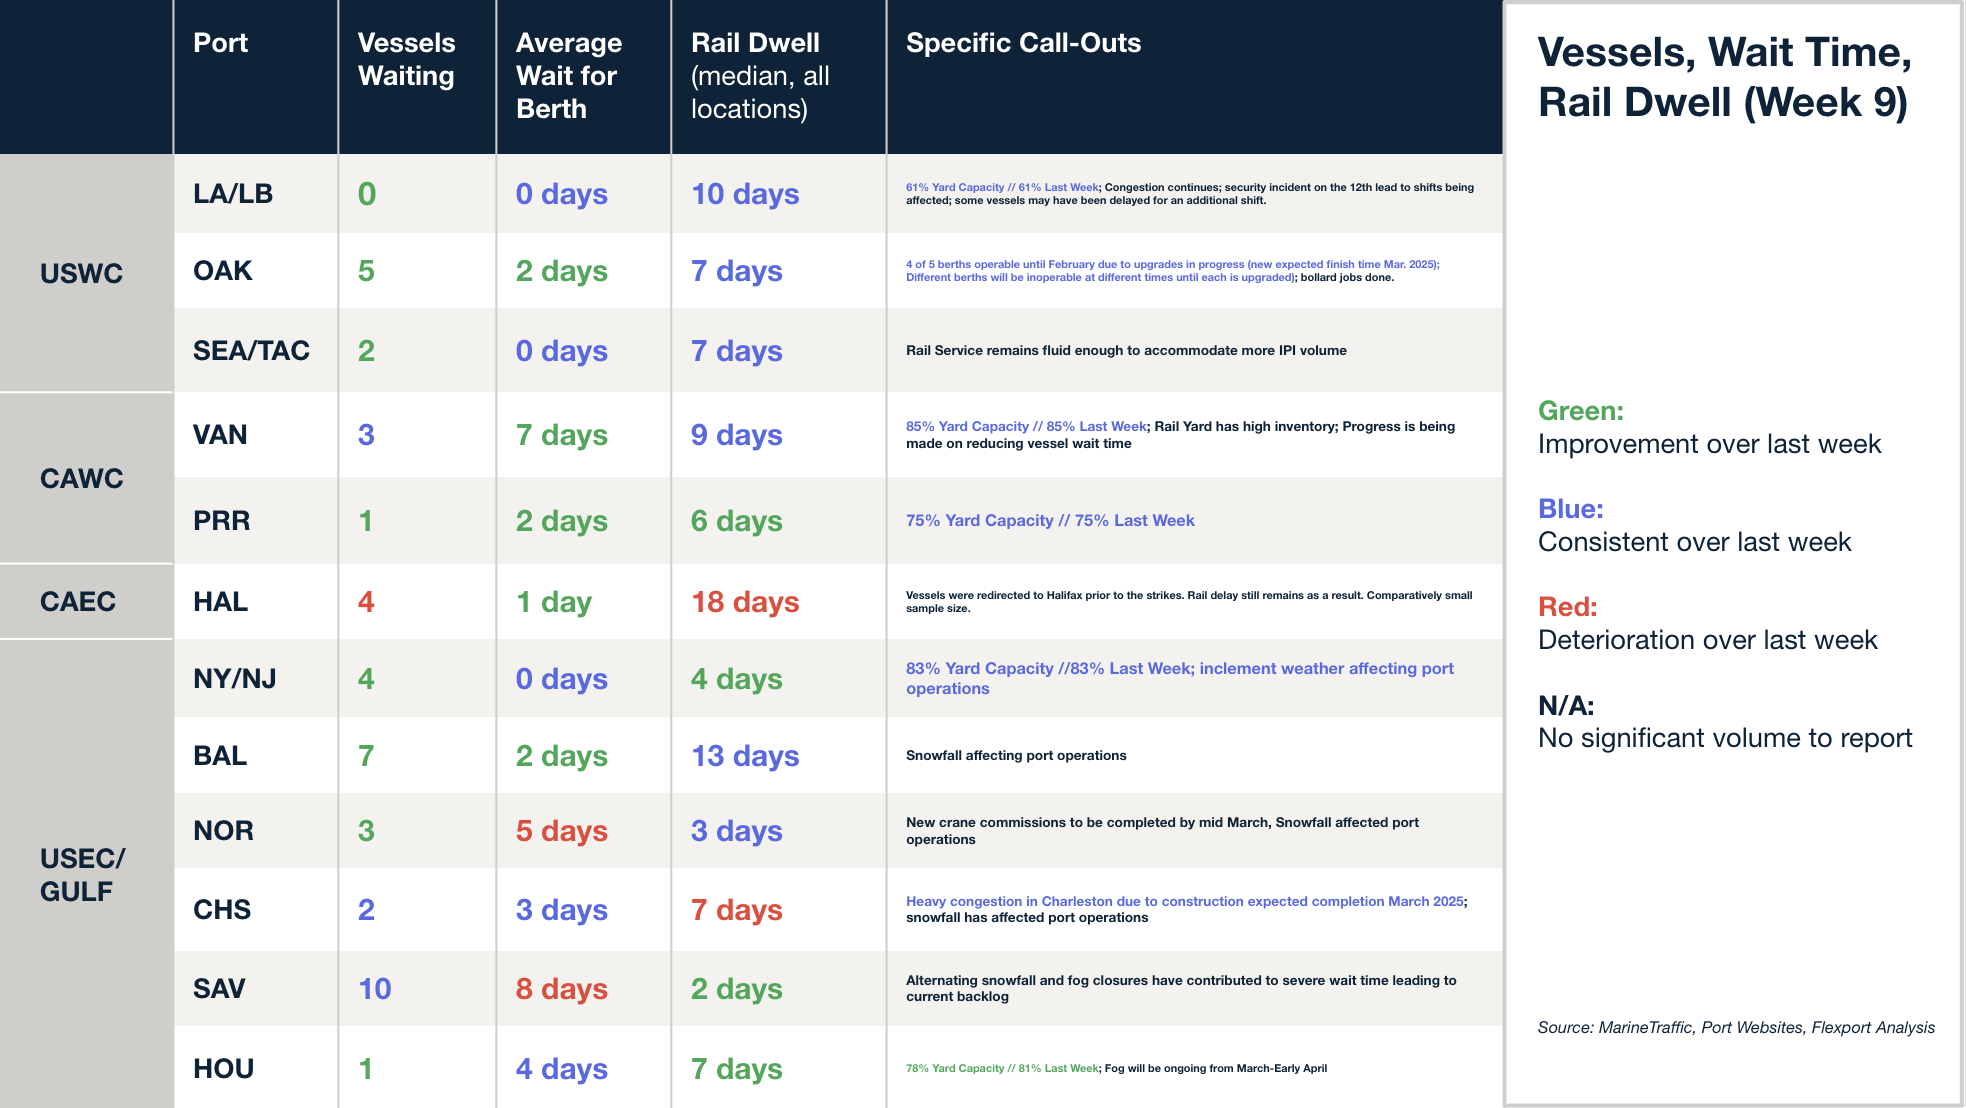
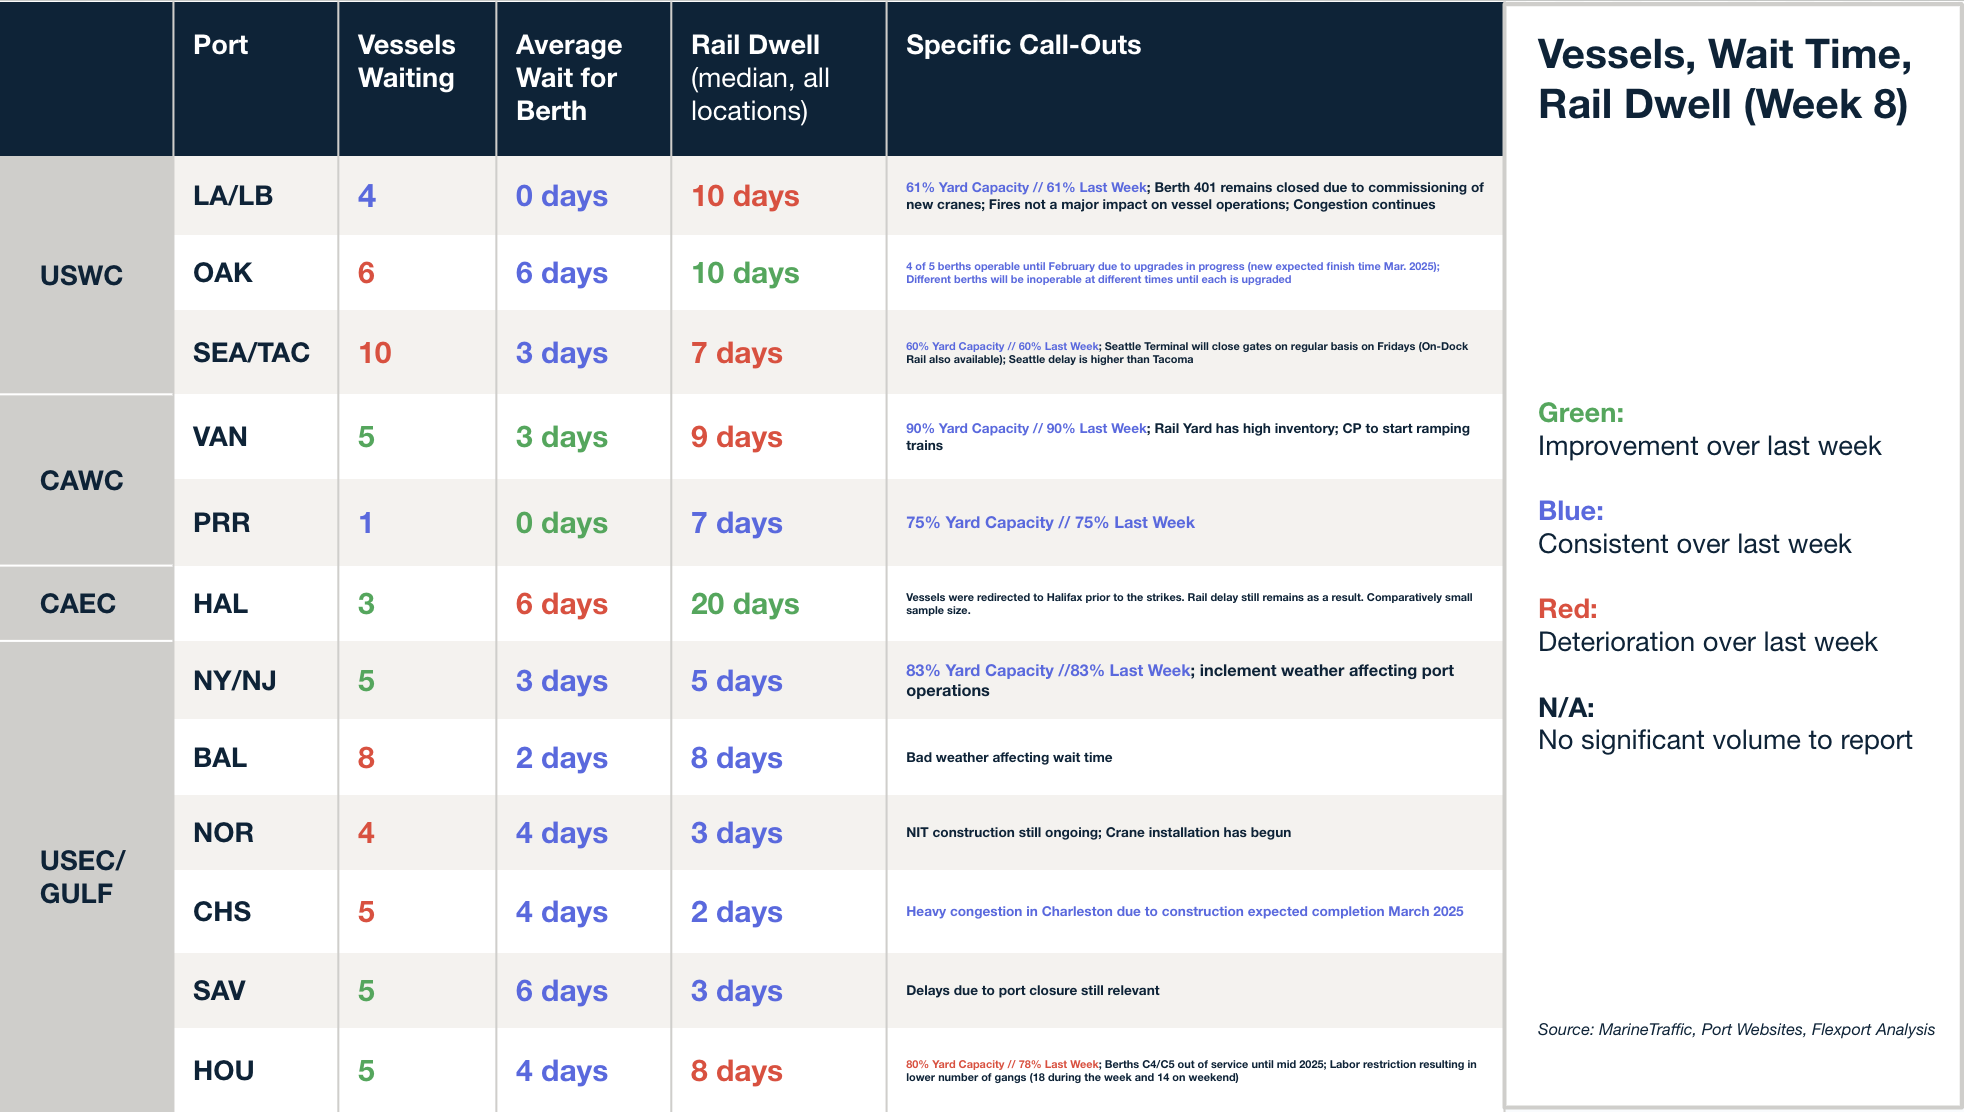
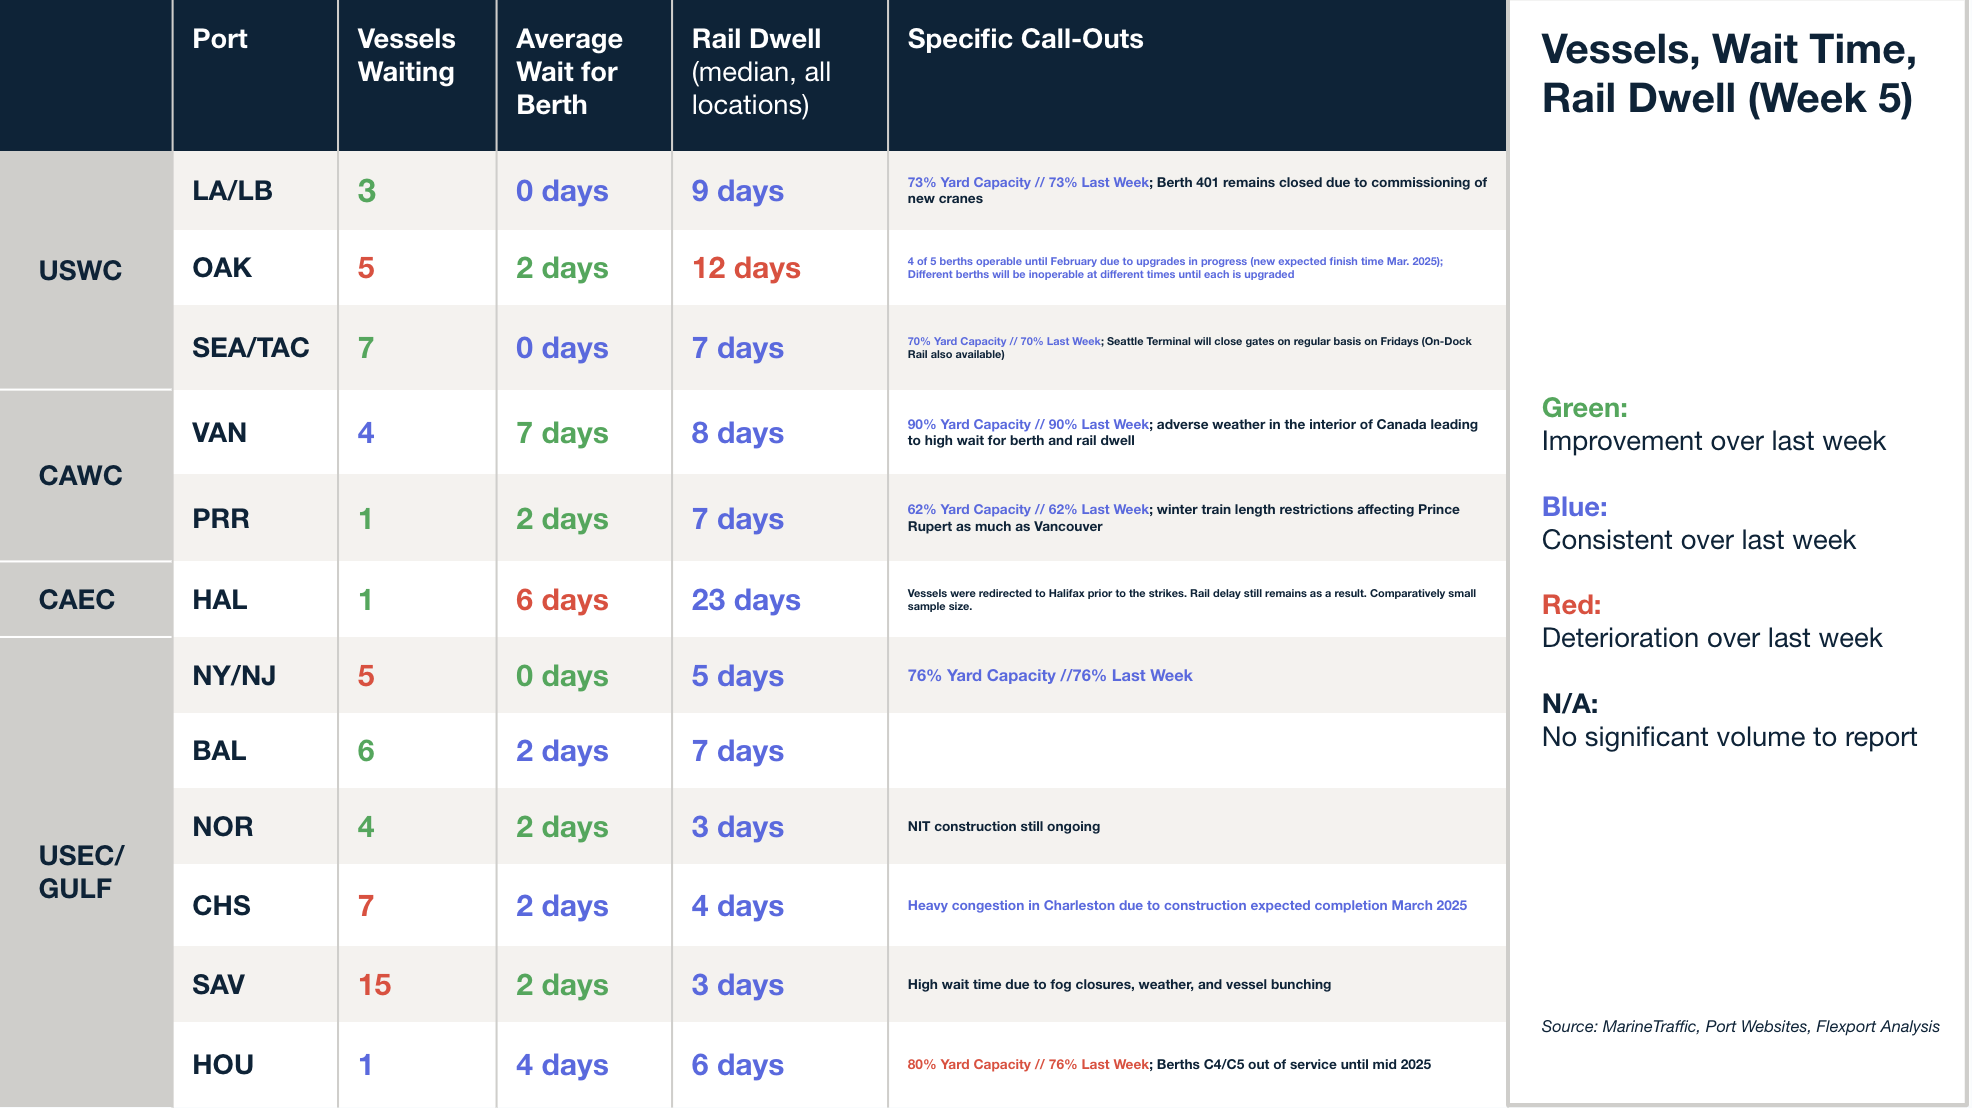
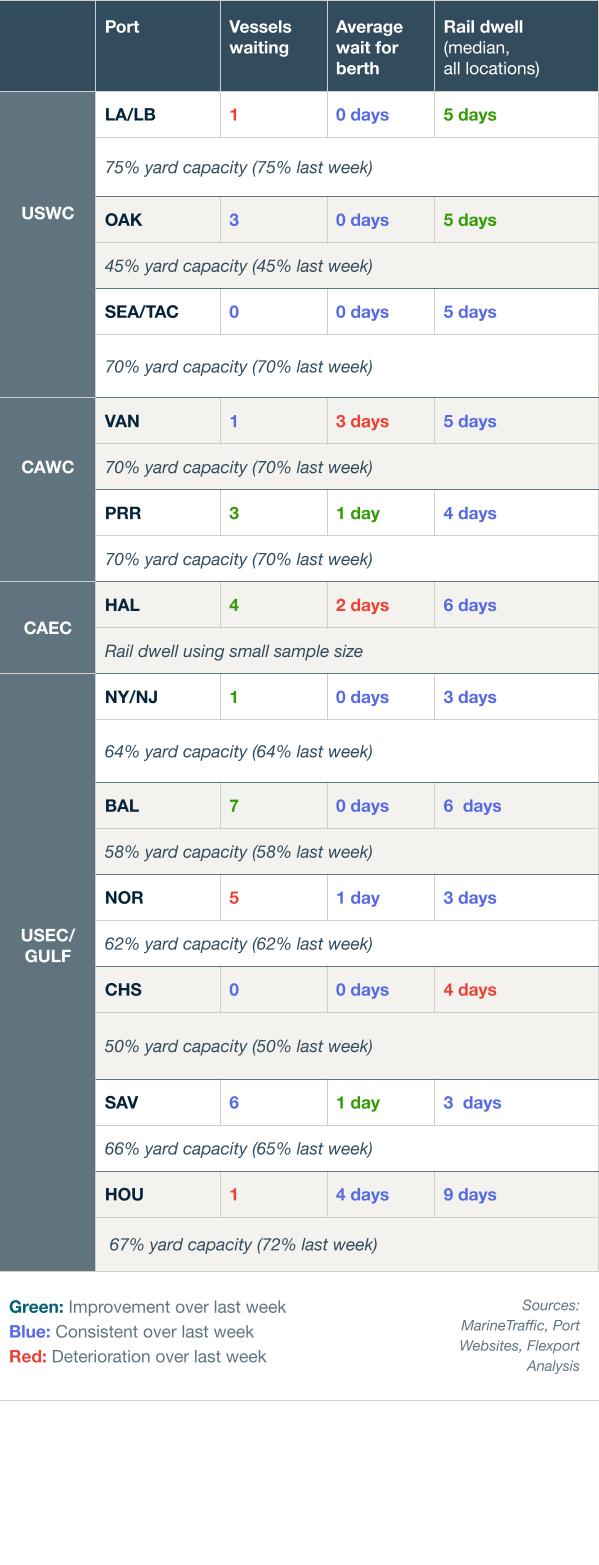
北美船舶停留时间
网络研讨会
Flexport Fall Technology Release Live Broadcast
Available On-Demand
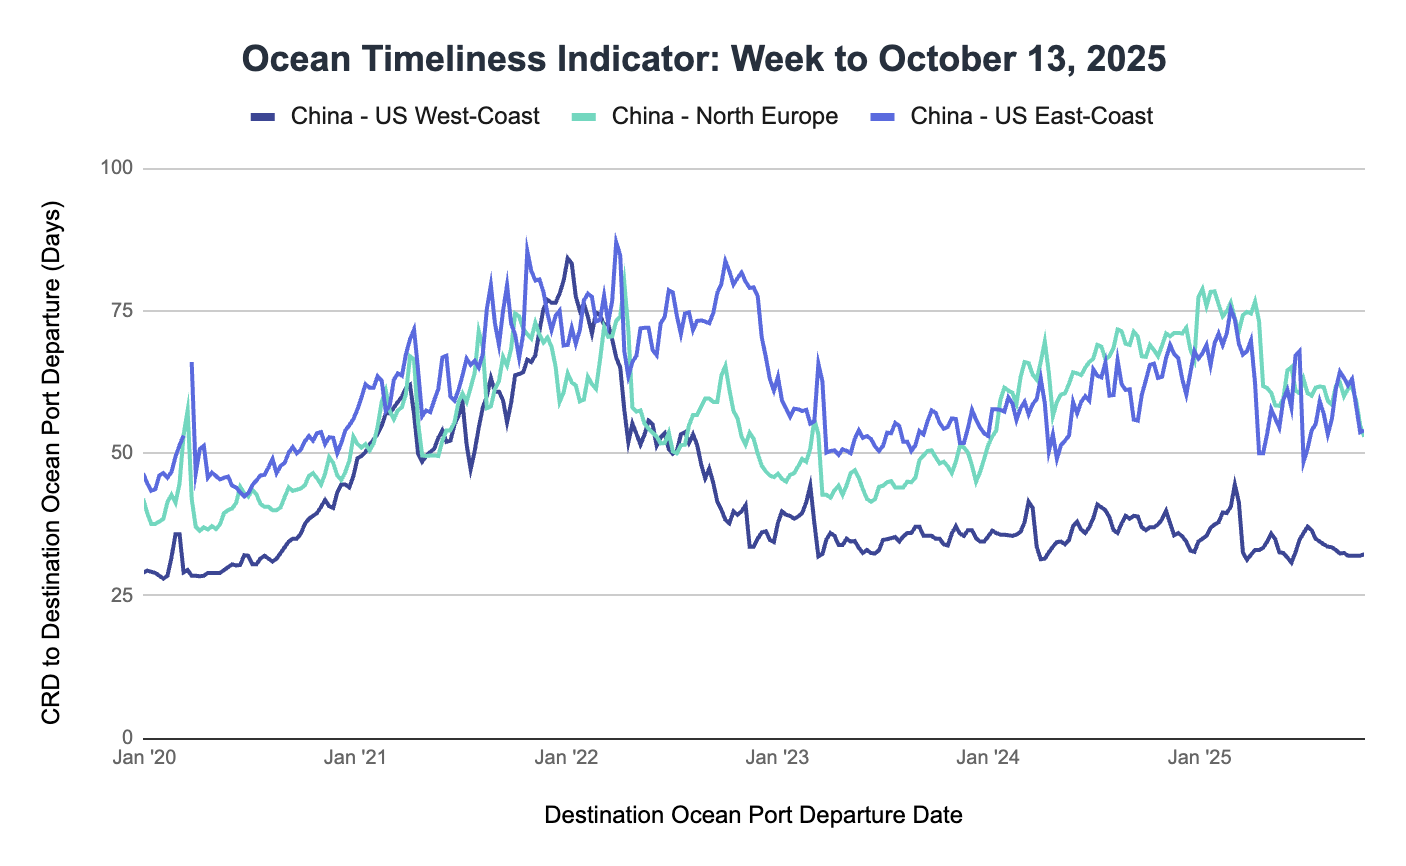
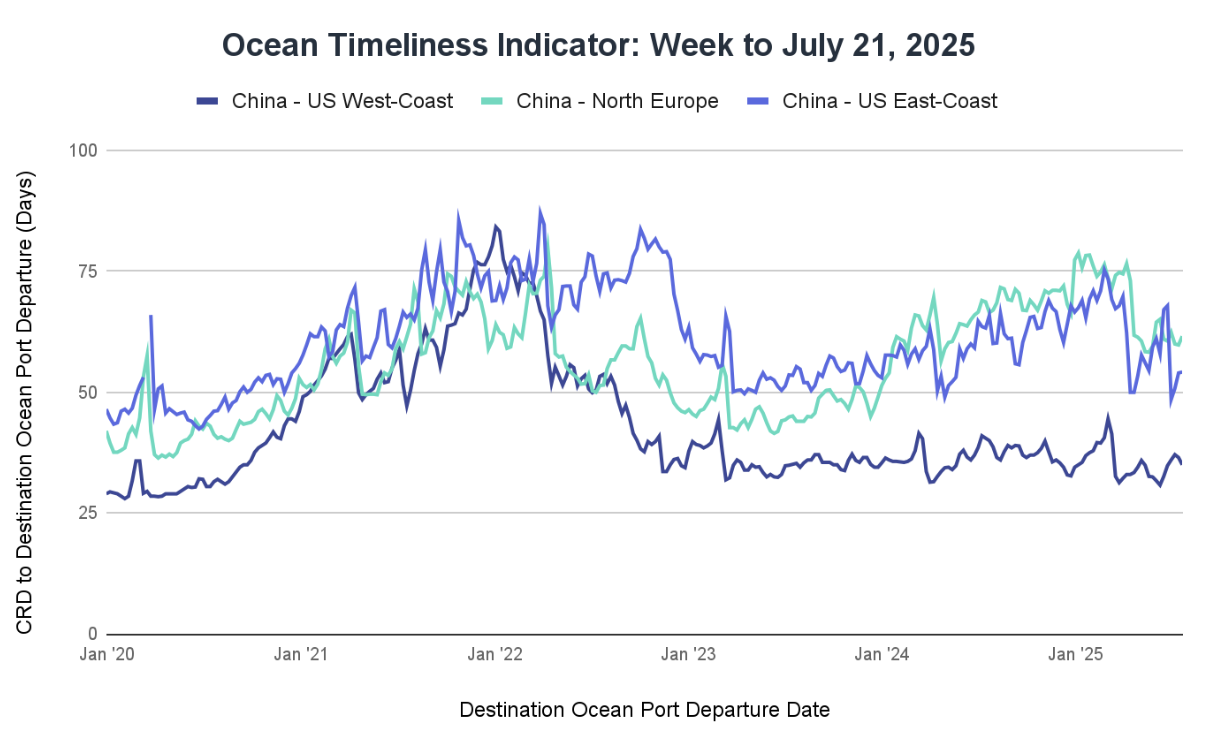
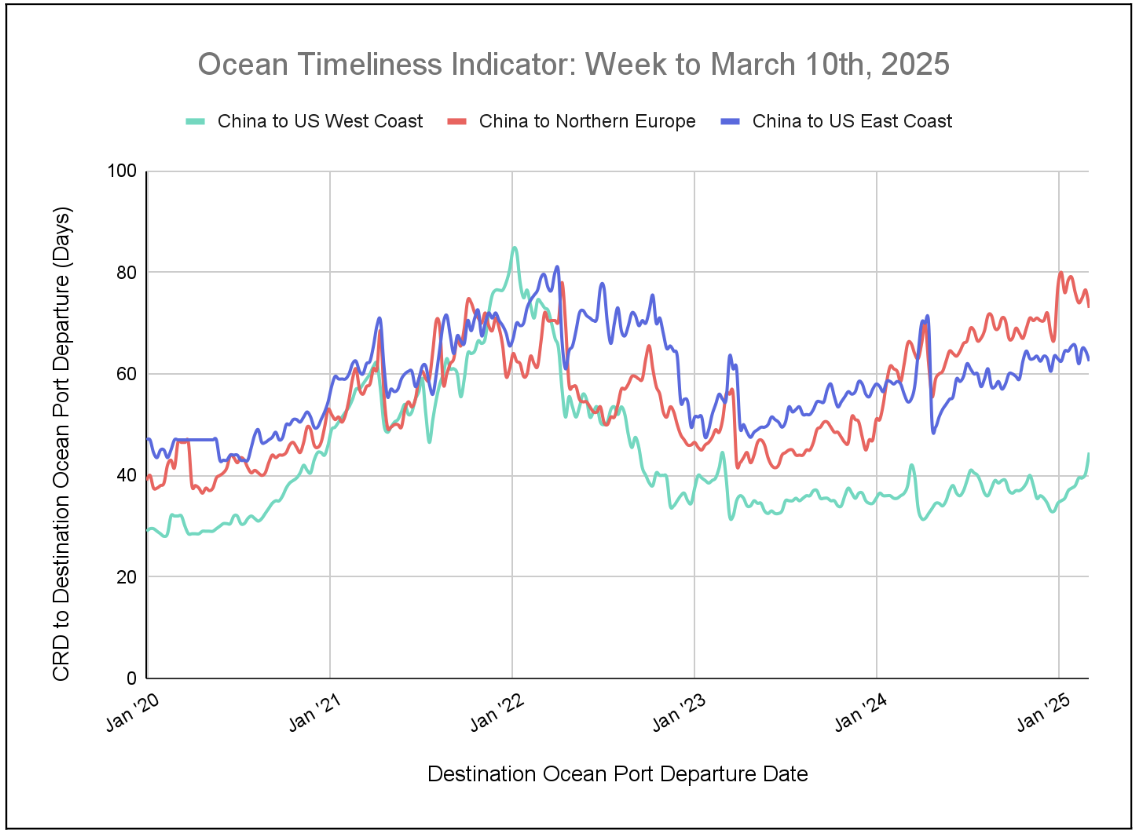
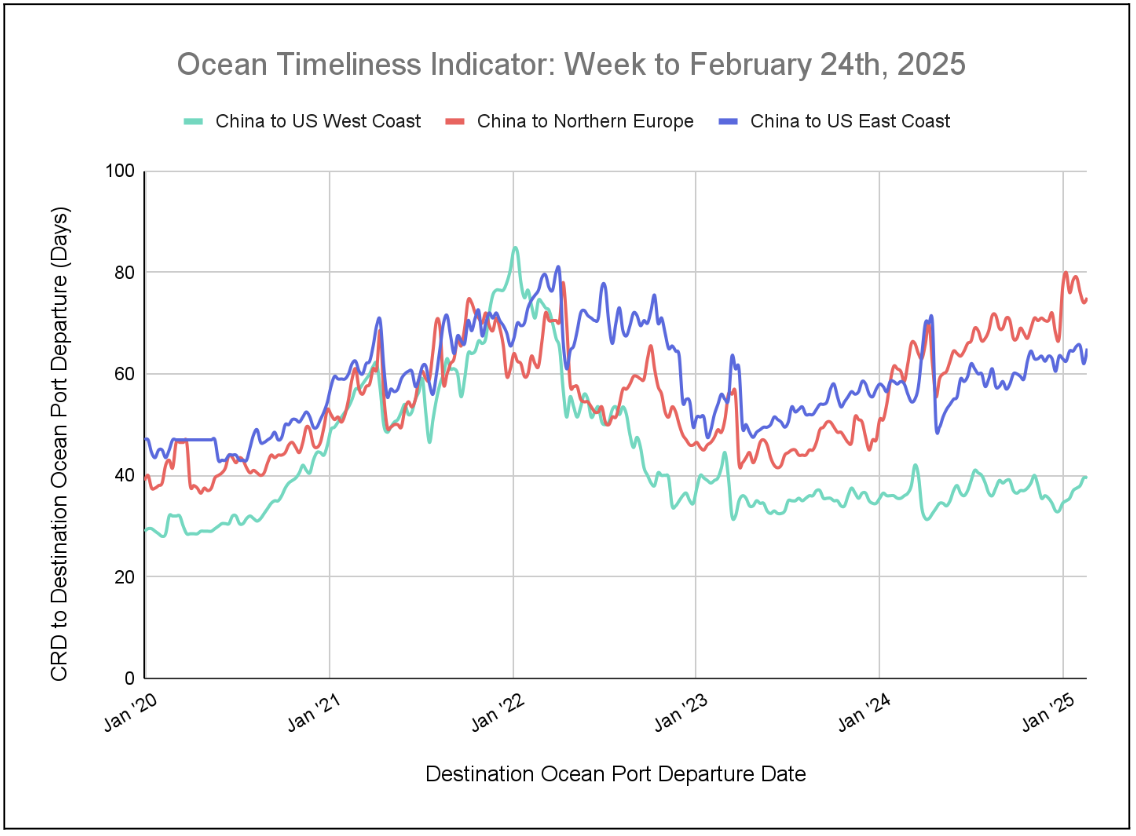
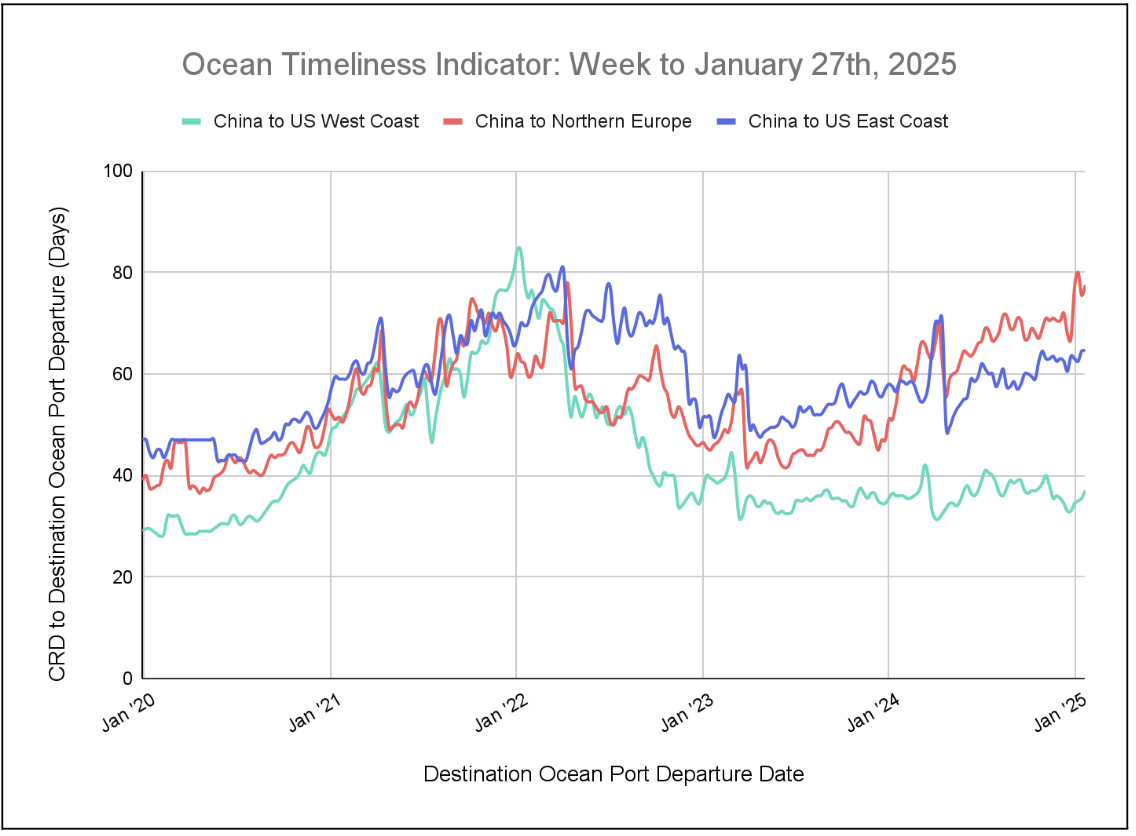
Ocean Timeliness Indicator
Transit times from China to the U.S. West Coast and China to the U.S. East Coast remained near-constant, while transit time from China to North Europe decreased.
Week to October 13, 2025
This week, transit time from China to the U.S. West Coast remained near-constant again, increasing from 32 to 32.3 days. Transit time from China to the U.S. East Coast also saw a slight increase, rising from 53.7 to 54 days. Meanwhile, transit time from China to North Europe dropped by 2 days, from 54.9 to 52.9 days.