Trends to Watch
[Ocean – TPEB]
- Volumes remain strong, exceeding last year’s numbers on Transpacific routes. We’re seeing structurally blank sailings due to Cape of Good Hope (COGH) routings and port congestion in Asia and North America. Due to the bad weather conditions around the COGH, please expect further delays and capacity challenges en route to the U.S. East Coast (EC). Since extra loader (XL) space was injected into the Transpacific trade lane, we’re seeing less space pressure on the U.S. West Coast (WC), specifically the Pacific Southwest (PSW) from China’s main ports.
- Floating rates: Shipping lines have started to reduce rates for the EC and WC to match supply and demand, with more significant pricing adjustments to the WC.
- Fixed rates: So far, shipping lines have not altered the Peak Season Surcharge (PSS), as the gap between NAC and FAK rates remains too large.
[Ocean – FEWB]
- Volumes are very strong and exceed last year’s numbers on the FEWB. We’re seeing structurally blank sailings due to Cape of Good Hope (COGH) routings and port congestion in Asia. A few extra loaders were injected into the FEWB in 2H July to compensate for downsized vessels and the extra transit time due to COGH routings.
- Floating rates: Shipping lines have started to increase rate levels and are offering some extra space to adapt to supply and demand.
- Fixed rates: Named account allocation remains very limited. Carriers stopped offering new long-term rate offers back in May; they’re protecting existing named account customers that are performing on a regular basis and offering limited allocation cutbacks in August.
- Equipment situation: Carriers have improved equipment supply, but are still seeing some shortages, specifically for NAC. Carriers are prioritizing high-paying contracts.
[Ocean – TAWB]
- In North Europe, demand is stable and rates are following the same trend. Rate levels are expected to remain stable until the end of September.
- In the Mediterranean, congestion and the delays are forcing blank sailings, which is driving 100% utilization across services. As a result, carriers are increasing rates (in the form of Peak Season Surcharges and General Rate Increases (GRIs)).
- To ensure the smoothest loading experience, we recommend booking 1-2 weeks in advance for bookings from North Europe, and 2-3 weeks for bookings from the Mediterranean that are loading at a coastal port.
[Indian Subcontinent to North America Update]
- Rates continue to increase due to capacity constraints. Structural and unexpected blank sailings, increased transit time around the Cape of Good Hope, and increases in demand are causing freight rates to surge into 2H July. Rates are expected to continue climbing into August, as no new capacity will be deployed until mid-month.
- Large rollover pools are adding further stress to upcoming sailings. Due to changing vessel sizes and an over-acceptance of bookings on each vessel, ocean carriers are being forced to roll cargo onto the next available sailing—not only delaying your shipments, but also taking away capacity for net-new bookings. As a result, some carriers have temporarily paused bookings to normalize loadings.
- These impacts are being felt differently across service providers, with many smaller providers being forced to use Spot Market booking platforms. (This means that their allotted space has been removed from the vessel plan in the short term.) These freight providers will now have to pay the market rate of over $10,000 per 40-foot container to obtain space.
- New India America Express (INDAMEX) services are expected to bring relief. Both HPL and CMA are launching their own standalone services to support Northwest India and Pakistan. These services will also temporarily support Colombo loadings on the first few sailings to clear accumulated backlogs in Sri Lanka. We can expect space to open up as these carriers, including their co-loaders OOCL and COSCO, will now have greater capacity than in 2023.
- Unrest in Bangladesh: Due to political protests, origin stakeholders have had limited access to the internet, social media, and telecommunications. Due to continued unrest, the Bangladeshi government made 7/22 and 7/23 public holidays. Delays are expected.
- Sri Lanka de-prioritization: Due to ongoing terminal congestion and changing rate levels in neighboring countries, Colombo as a port of loading has been deprioritized with regard to its typical direct sailings. Most carriers are now skipping the direct Colombo call and opting for a transhipment over Singapore for all shipments. This has put pressure on South Indian, Bangladeshi, and Colombo shipments, which typically rely on Colombo as a transhipment hub or port of loading.
[Ocean – U.S. Exports]
- Ocean rates for Q3 are increasing in corridors of the U.S. export market due to rising demand in global container markets.
Congestion at critical transhipment hubs is reducing effective capacity for U.S. exporters. - Navigating ever-changing earliest return dates (ERDs) has become increasingly challenging due to current market congestion.
- To ensure the smoothest loading experience, we recommend booking 3-4 weeks in advance for shipments loading at a coastal port, and 4+ weeks in advance for shipments loading at an inland rail point.
[Air – Global] (Source: WorldACD)
- Slight decline in worldwide tonnages: In week 28 (July 8-14, 2024), there was a -1% drop in global air cargo tonnages, with Europe, the Asia-Pacific, and Africa experiencing declines of -5%, -2%, and -5%, respectively. Meanwhile, North America and Central and South America saw increases of +6% and +4%, respectively.
- Decrease in average worldwide rates: The average worldwide air cargo rate decreased by -1% to $2.50 per kilo in week 28, which is still +11% higher year-on-year (YoY) and +44% higher than in July 2019. Asia-Pacific and MESA origins saw significant year-on-year rate increases of +23% and +51%, respectively.
- Spot rate analysis: Spot rates from various East Asian origins to Europe decreased in week 28, with Thailand and Taiwan experiencing drops of -16% and -11%, respectively. Conversely, Hong Kong, South Korea, and Japan saw increases in spot rates to Europe of +7%, +5%, and +3%, respectively, despite a -8% fall in tonnages from Hong Kong.
- Stable U.S. spot rates from the Asia-Pacific: Spot rates from the Asia-Pacific to the U.S. remained stable in week 28, with significant year-on-year increases of +63% from China and +38% from other Asian-Pacific origins.
- MESA to Europe trends: High tonnages and price levels from MESA to Europe continue due to Red Sea disruptions. In week 28, MESA to Europe demand dropped by -7%, but spot rates remained substantially higher than last year’s rates, with Dubai, India, and MESA seeing respective increases of +17%, +82%, and +16% in tonnages, and spot rates up by +126% since last year. India to Europe spot rates were $3.49 per kilo, up +158% YoY, while Bangladesh to Europe rates held firm at $4.25 per kilo.
Please reach out to your account representative for details on any impacts to your shipments.
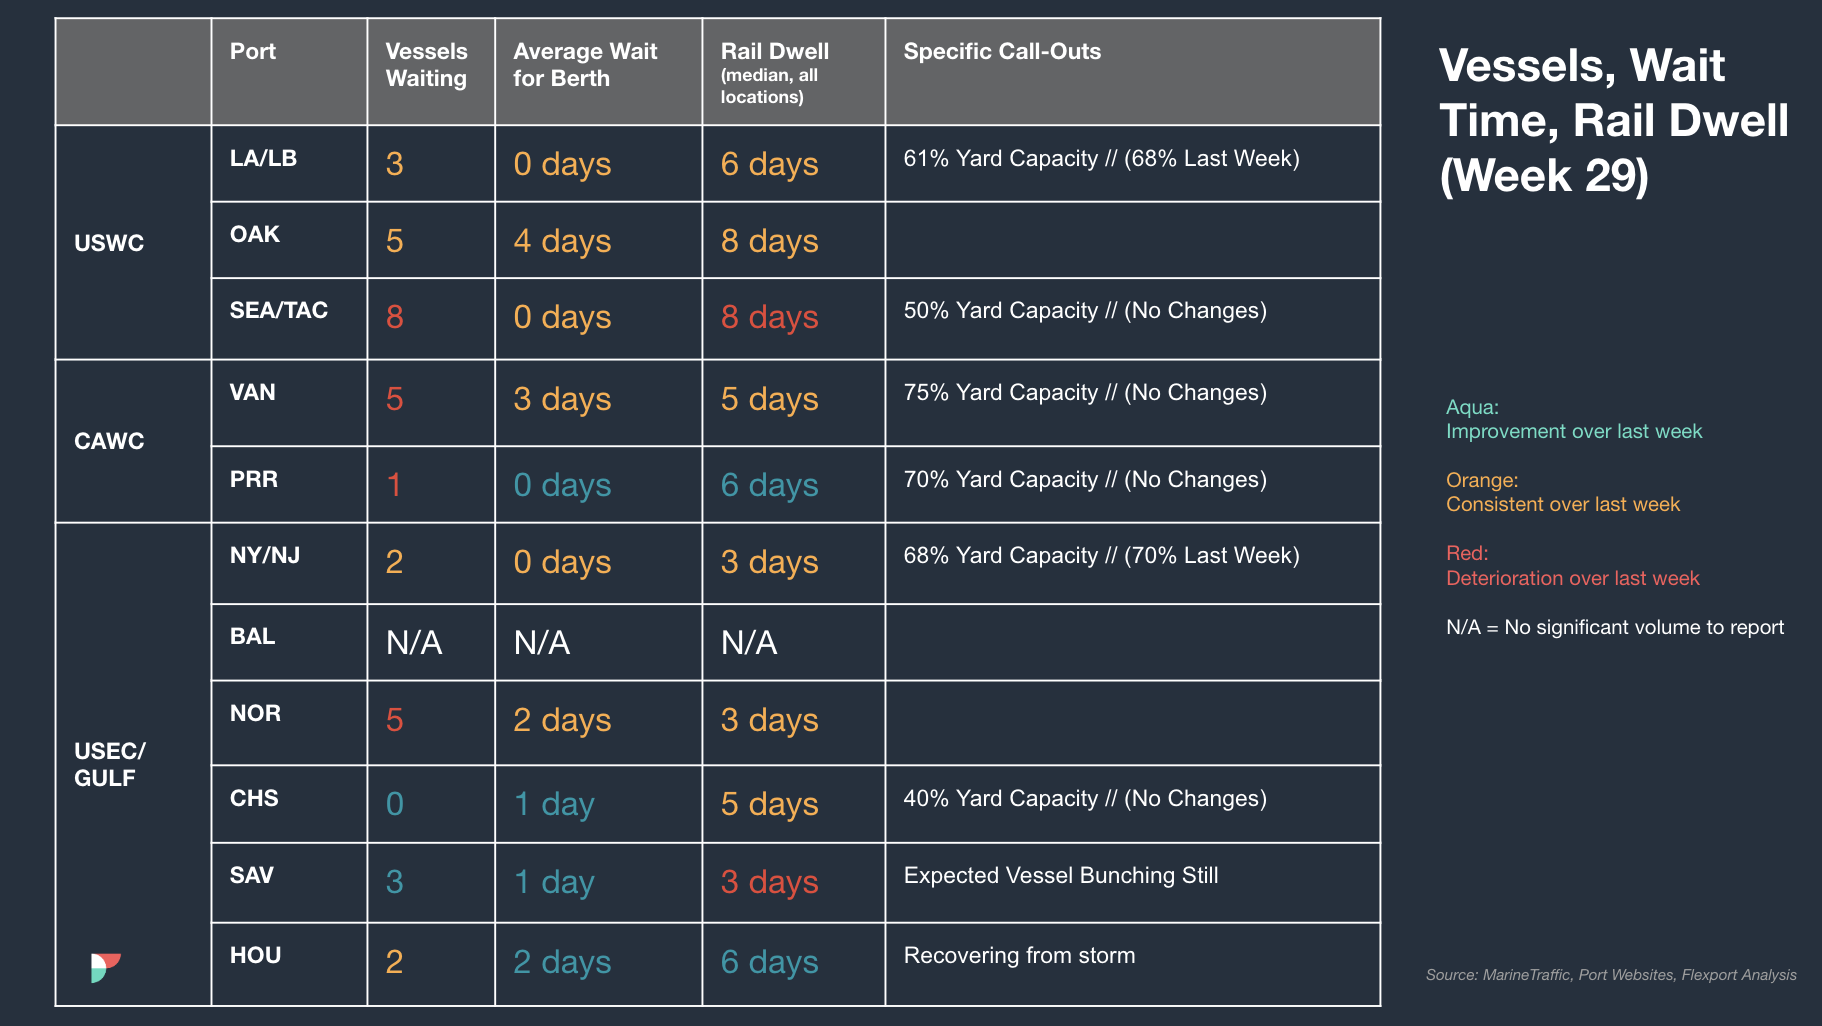
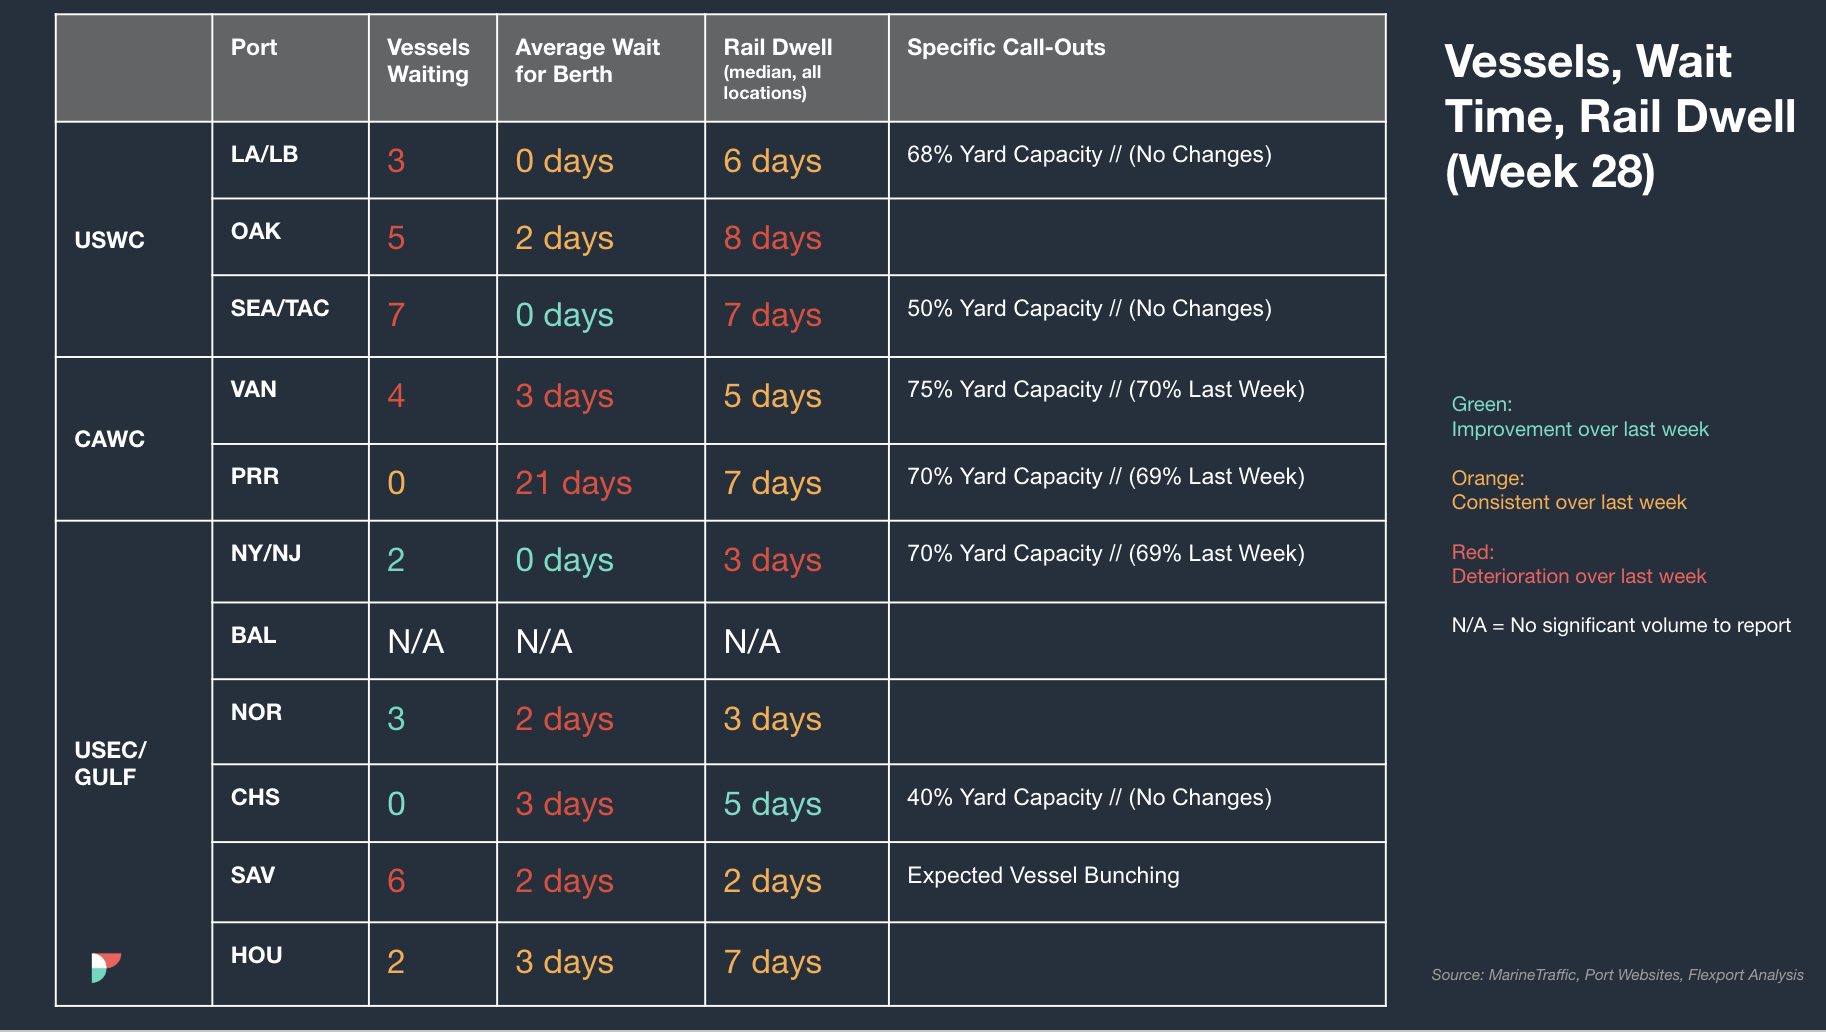
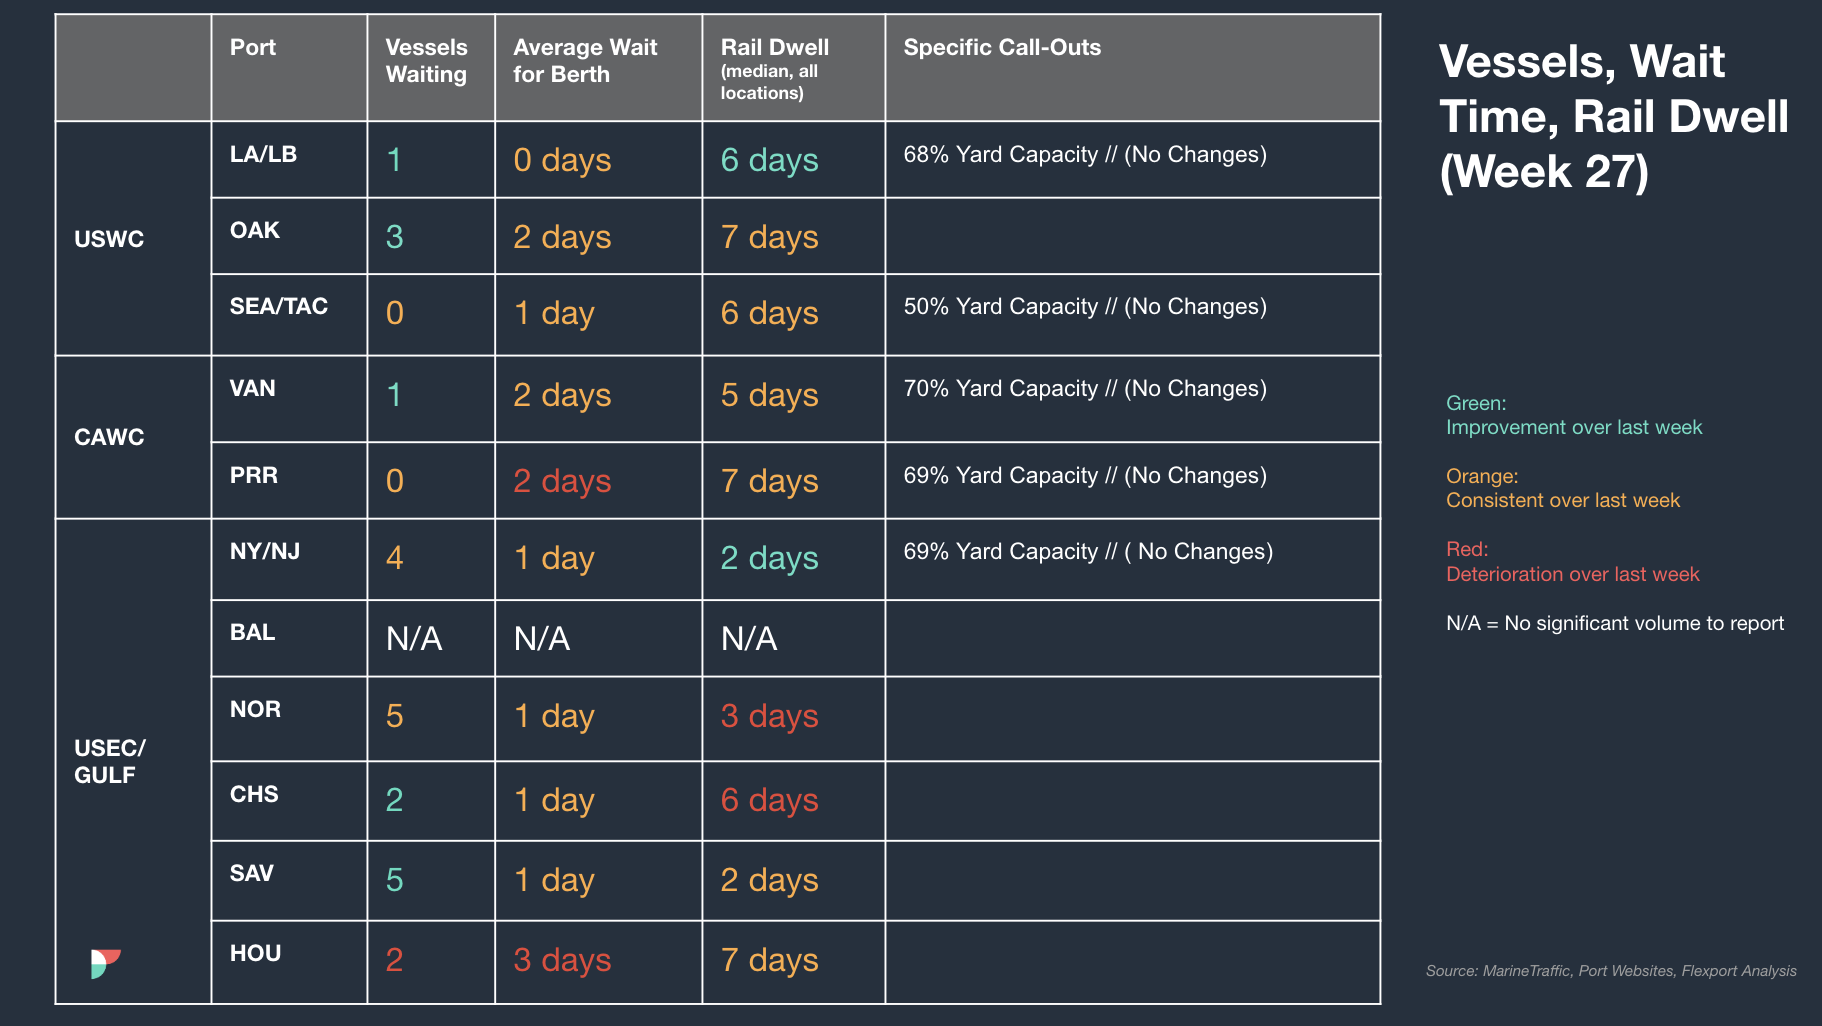
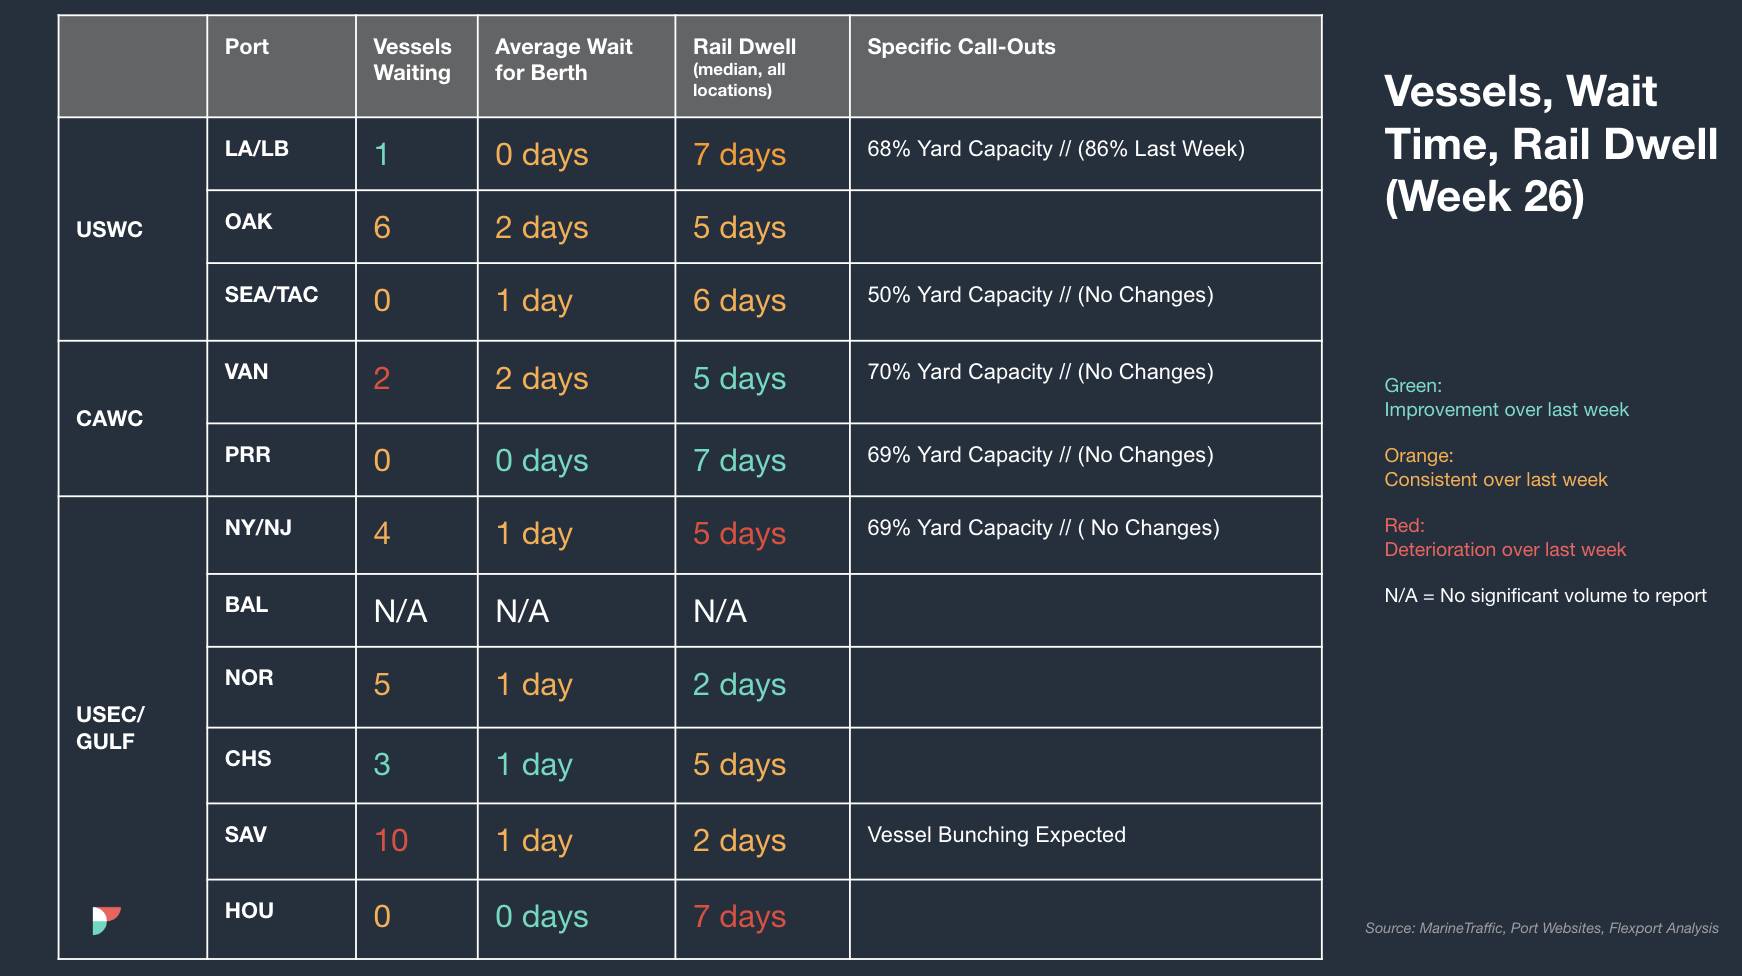
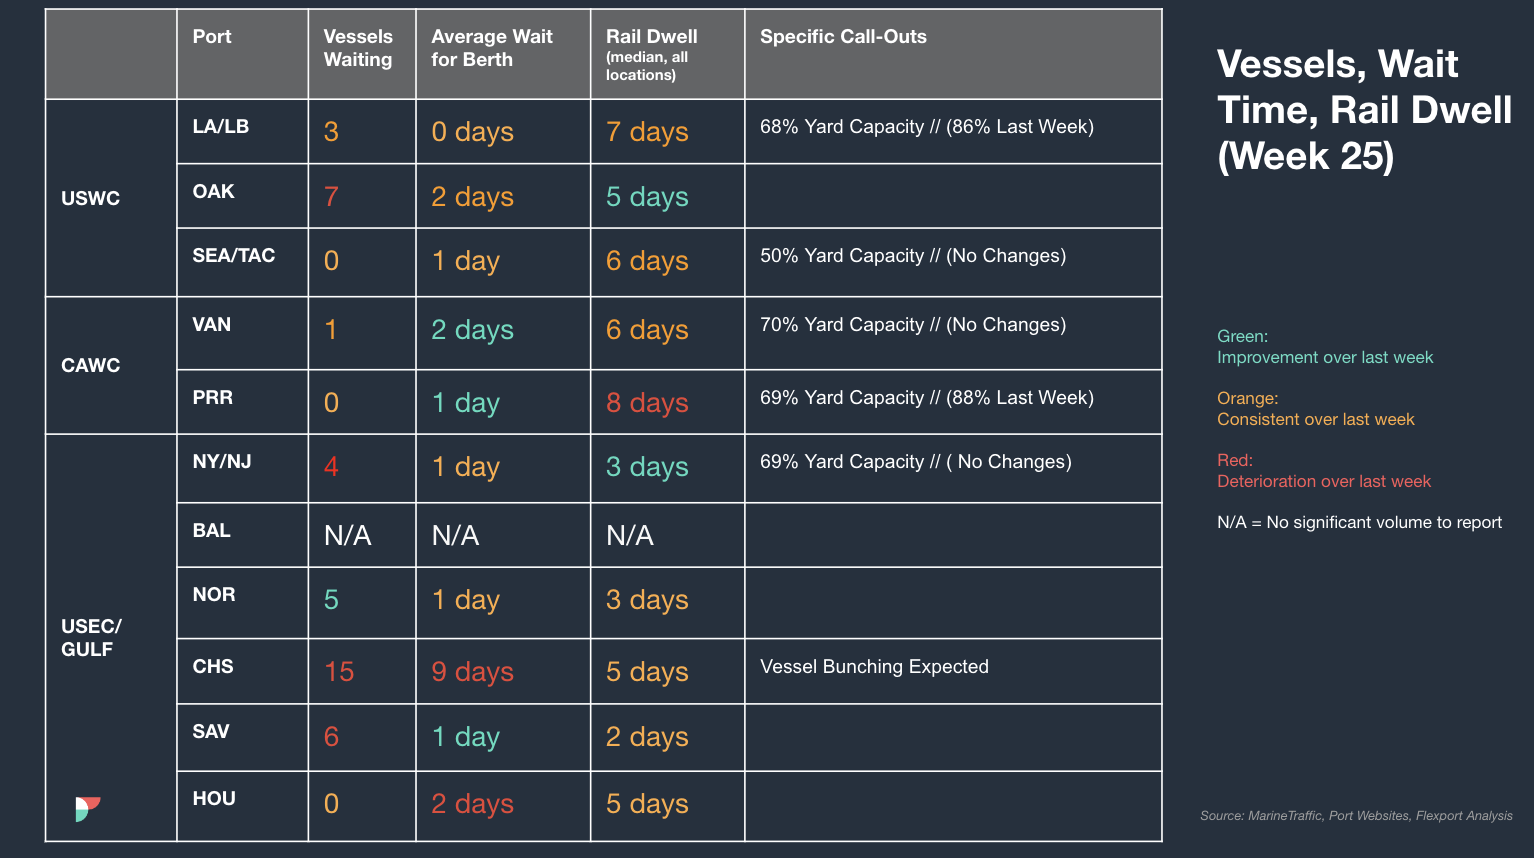
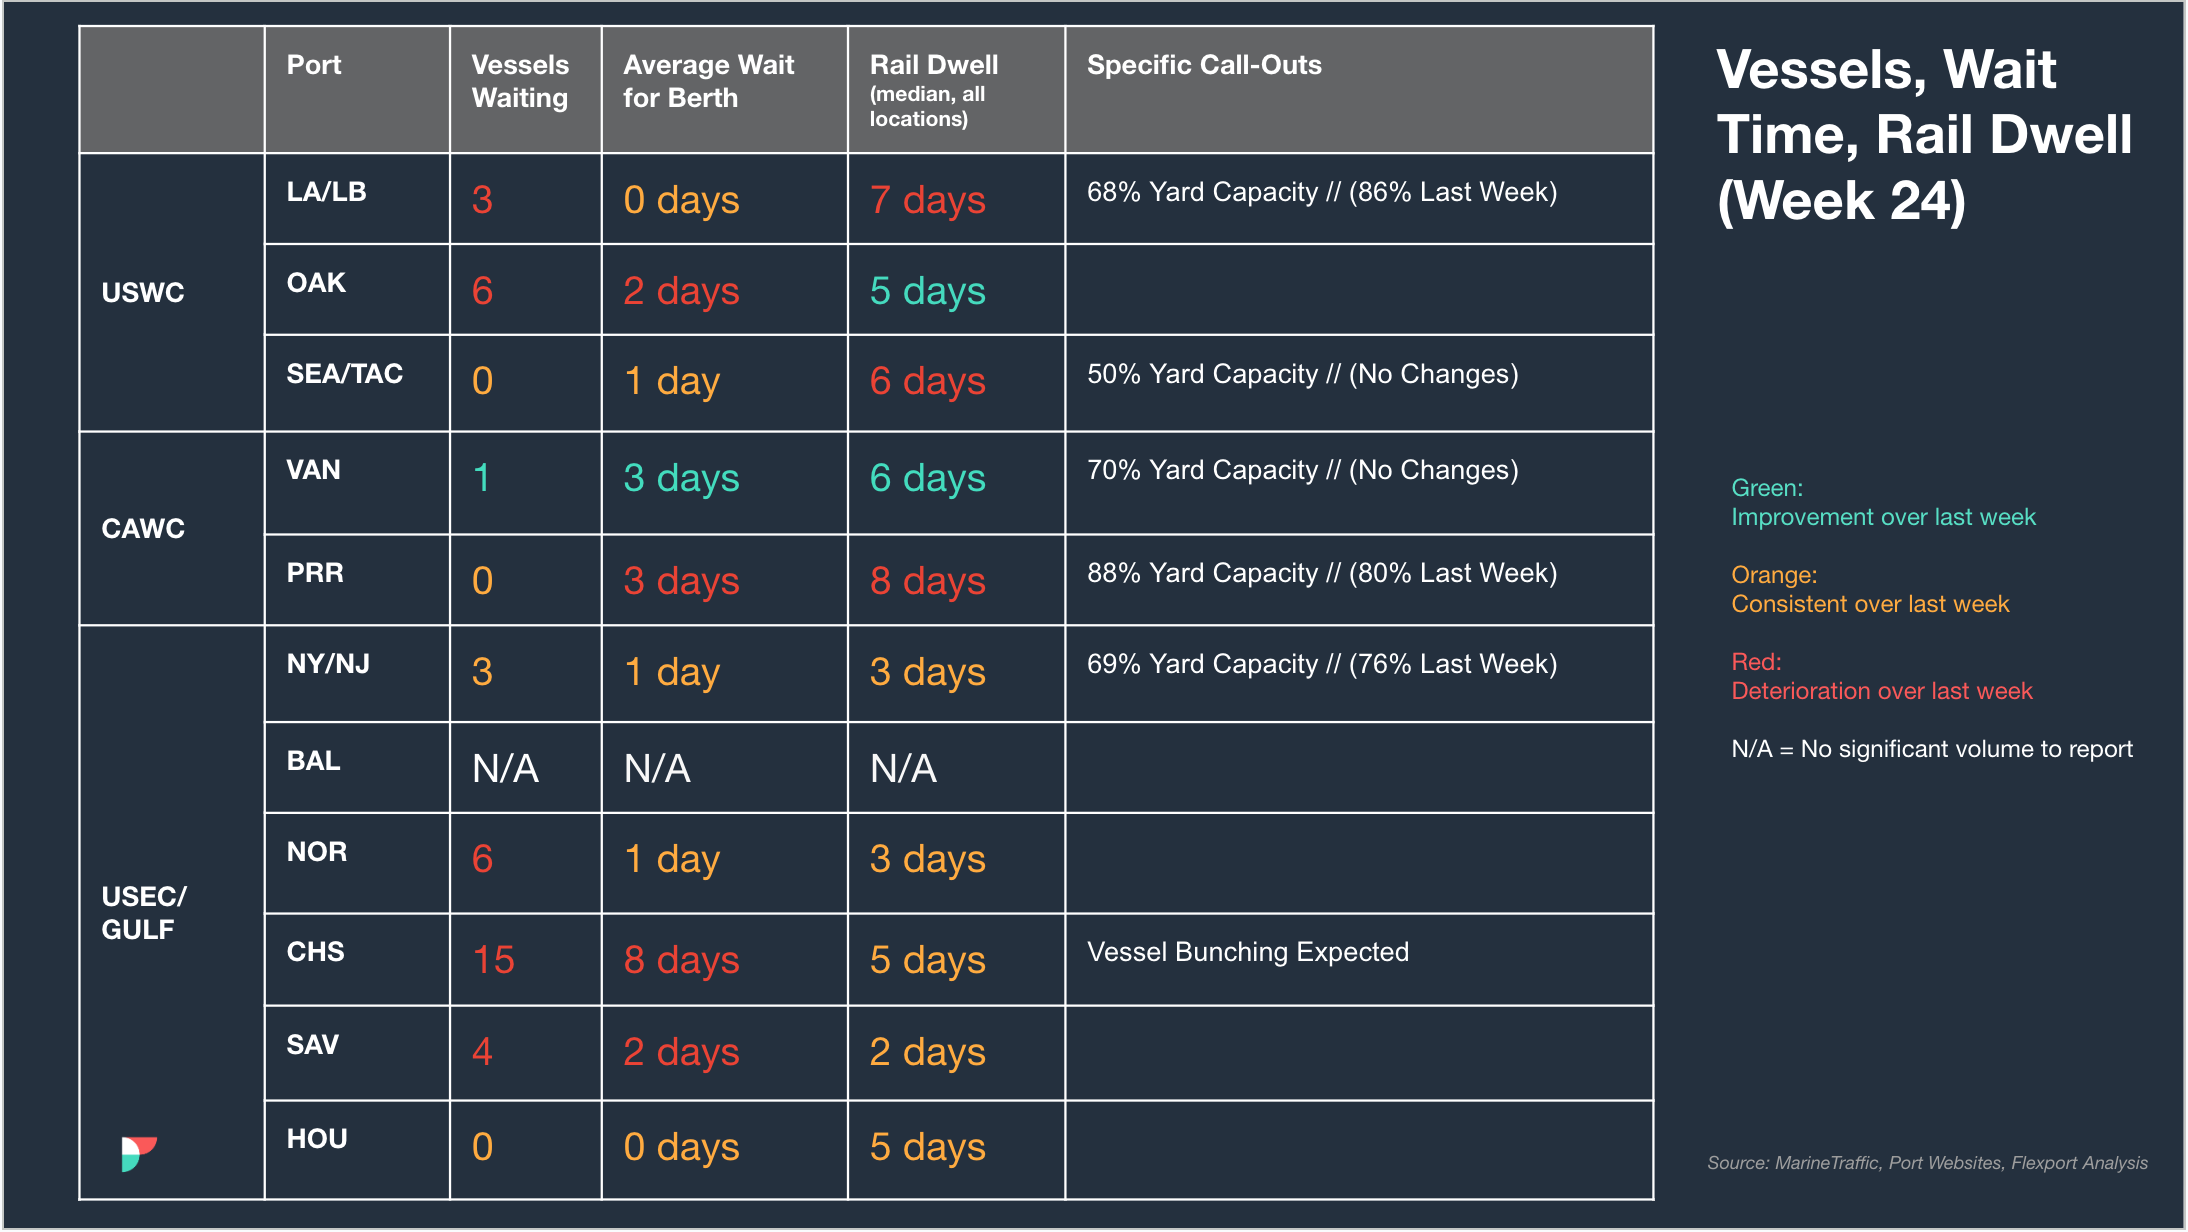
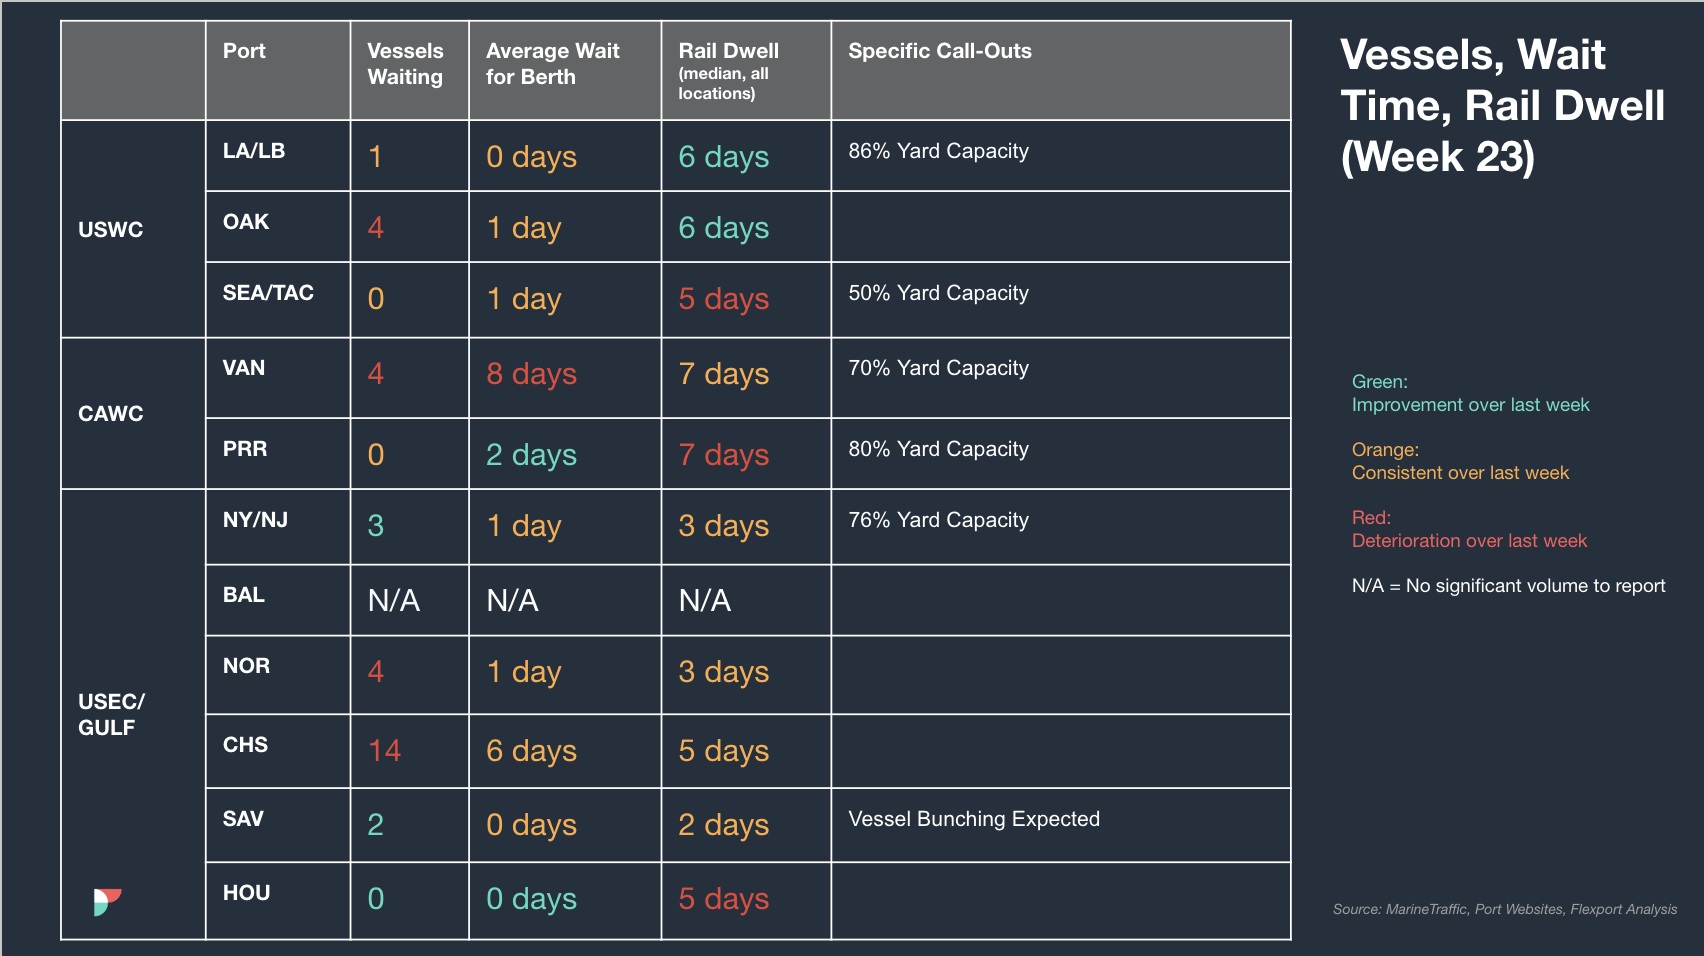
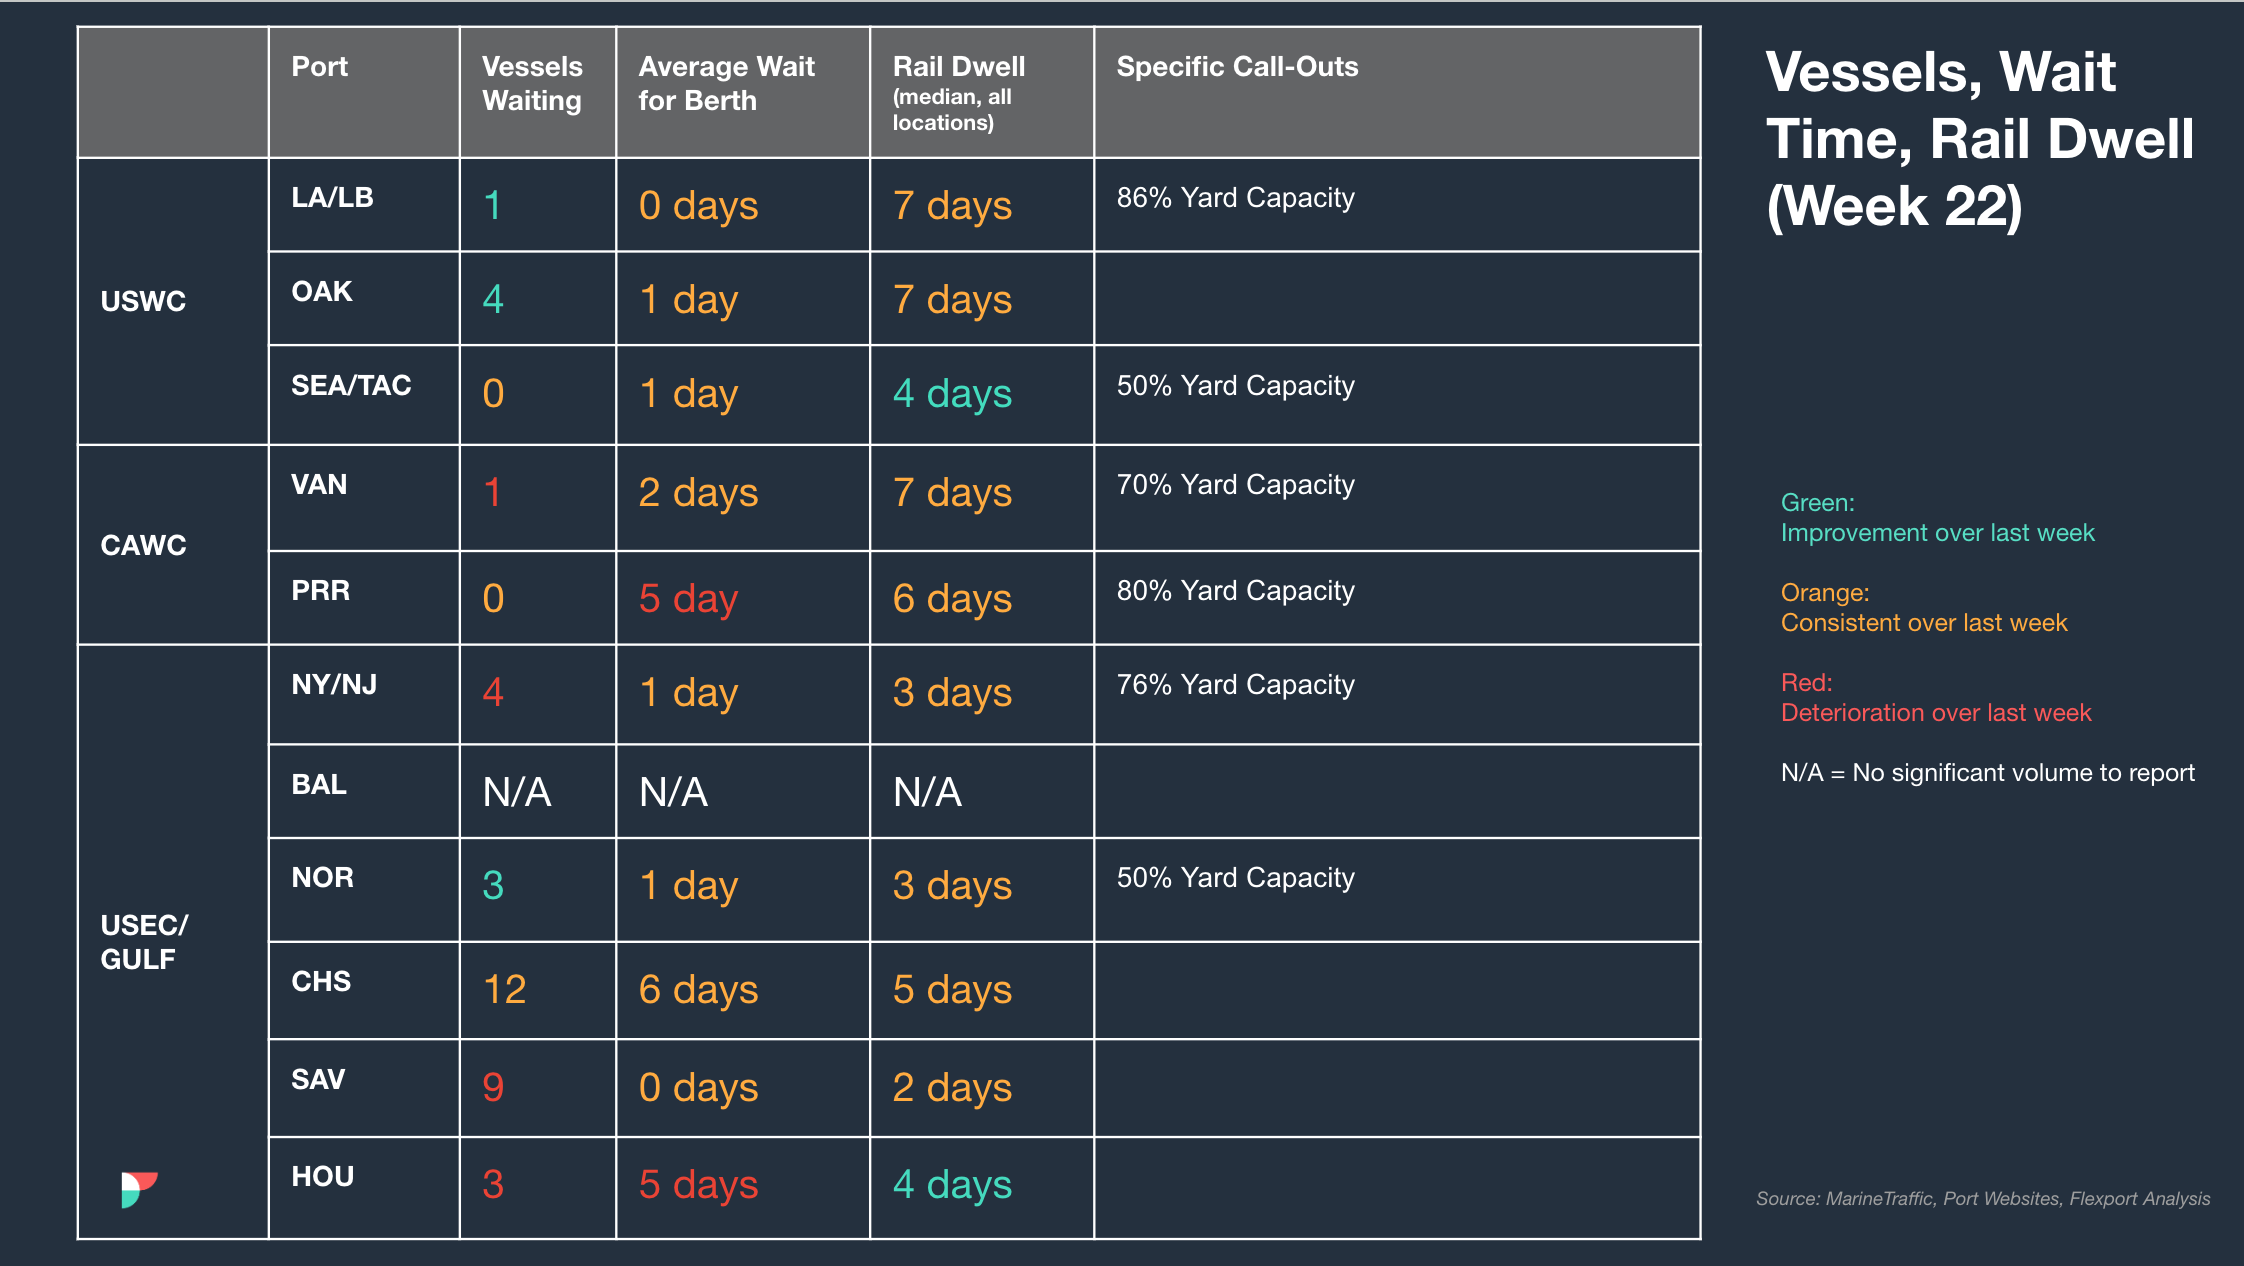
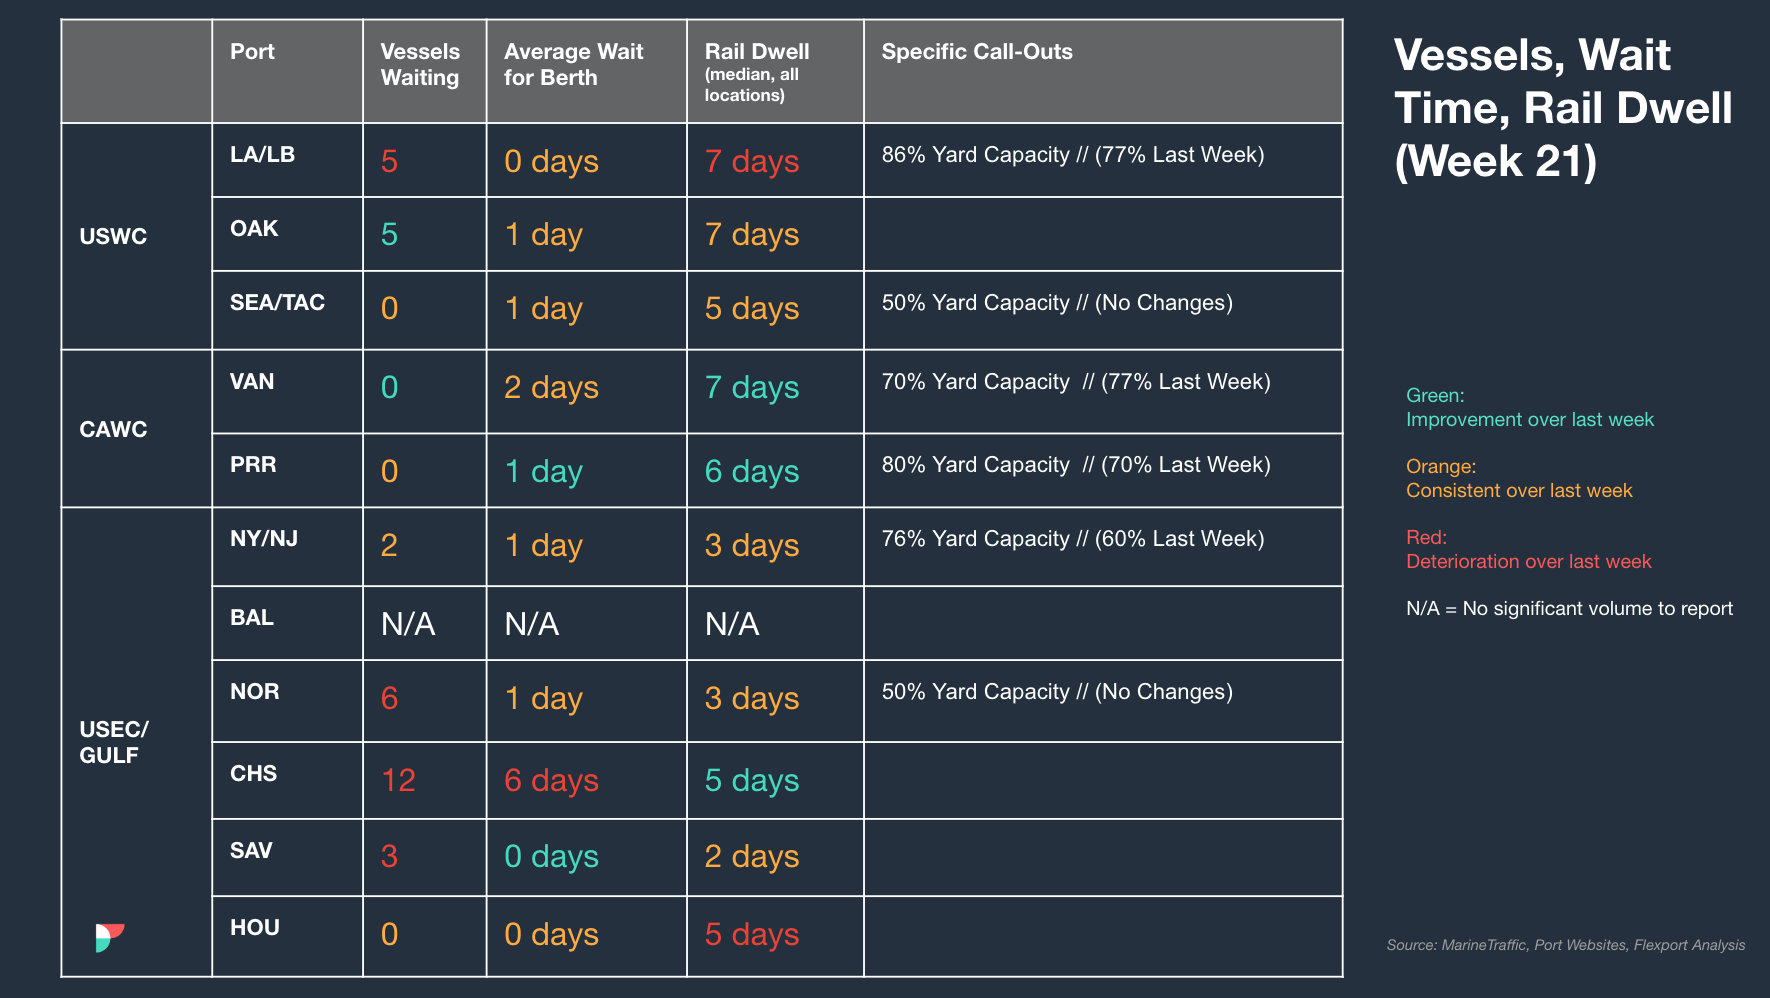
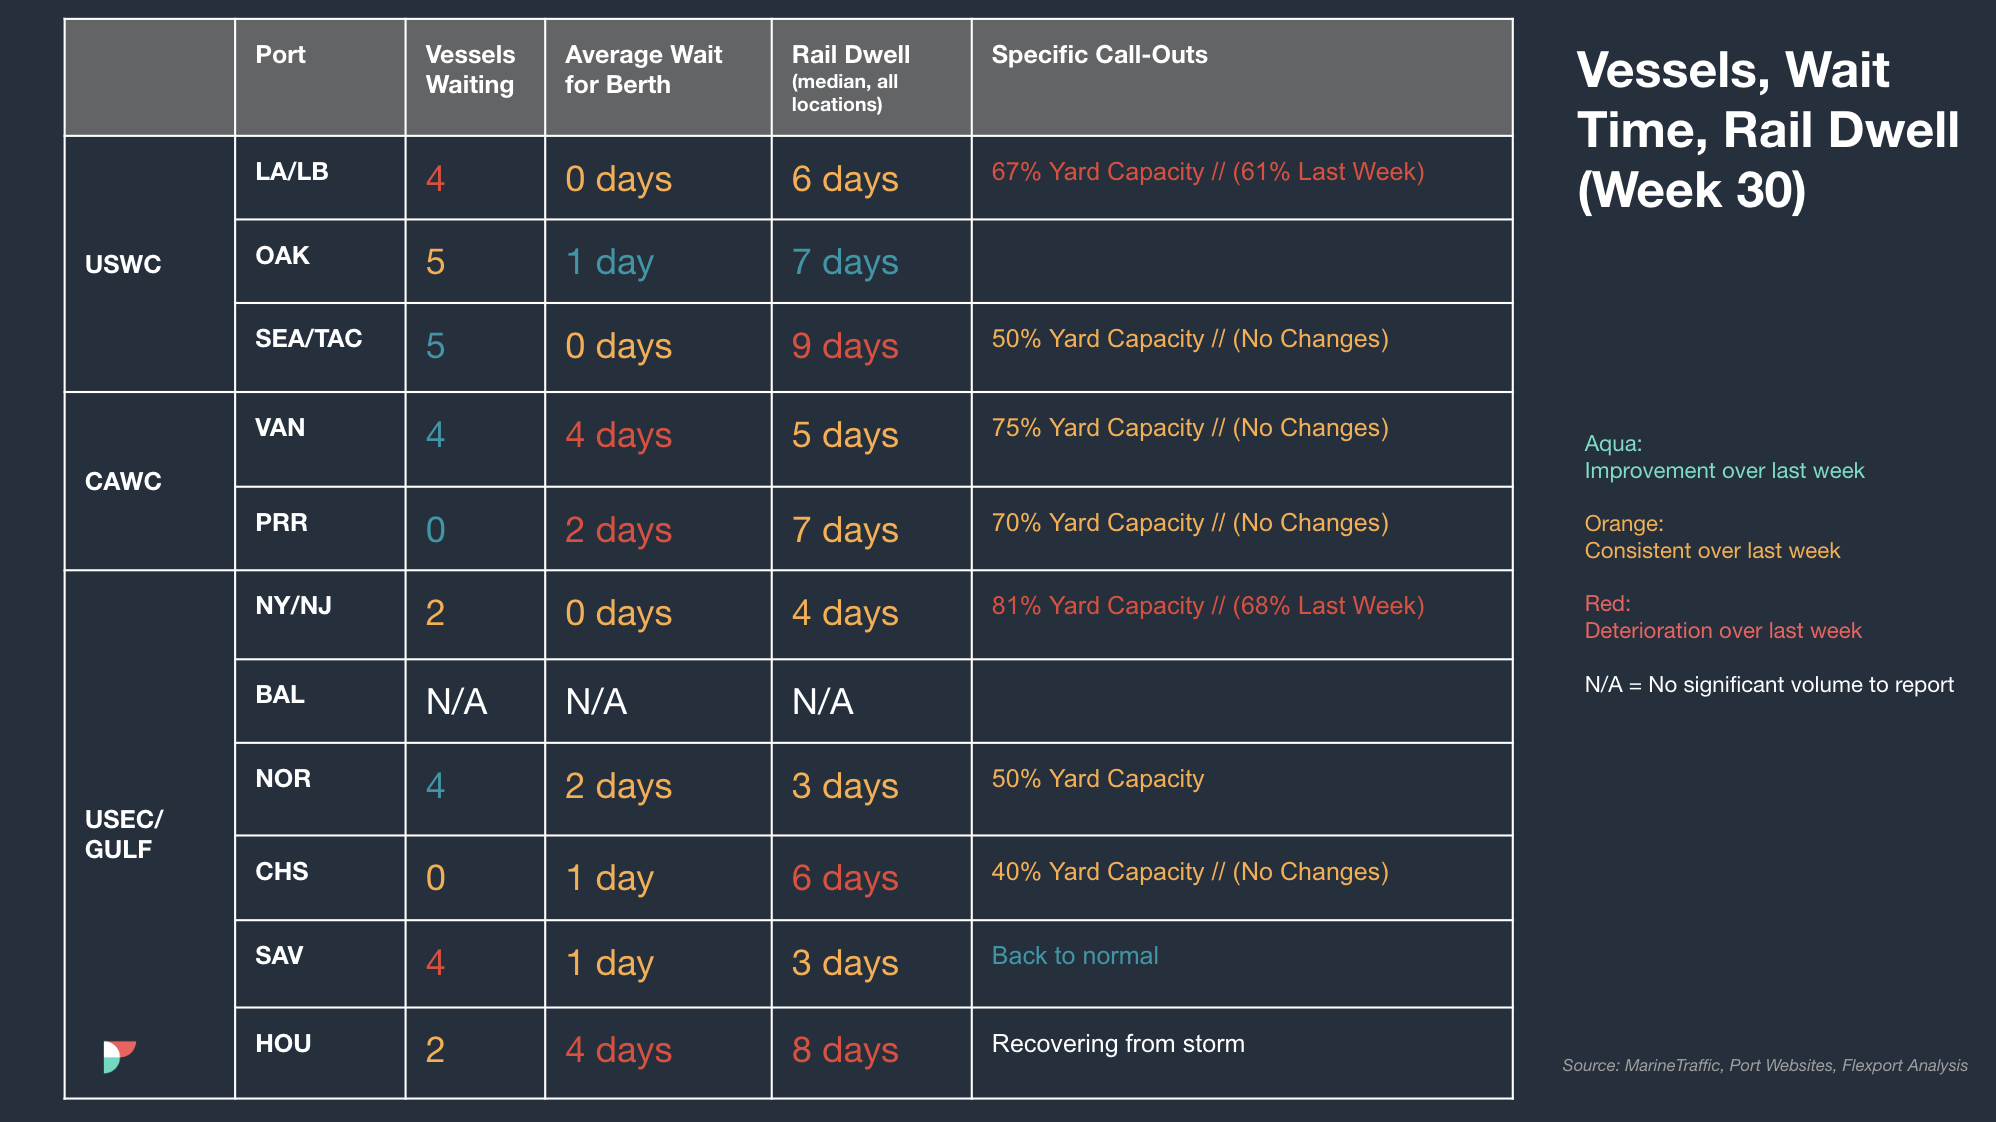
North America Vessel Dwell Times
Webinars
Revolutionize Your Fulfillment: Grow with Walmart Marketplace
(Today) July 25 @ 9:00 am PT / 12:00 pm ET
North America Freight Market Update Live
August 8 @ 9:00 am PT / 12:00 pm ET
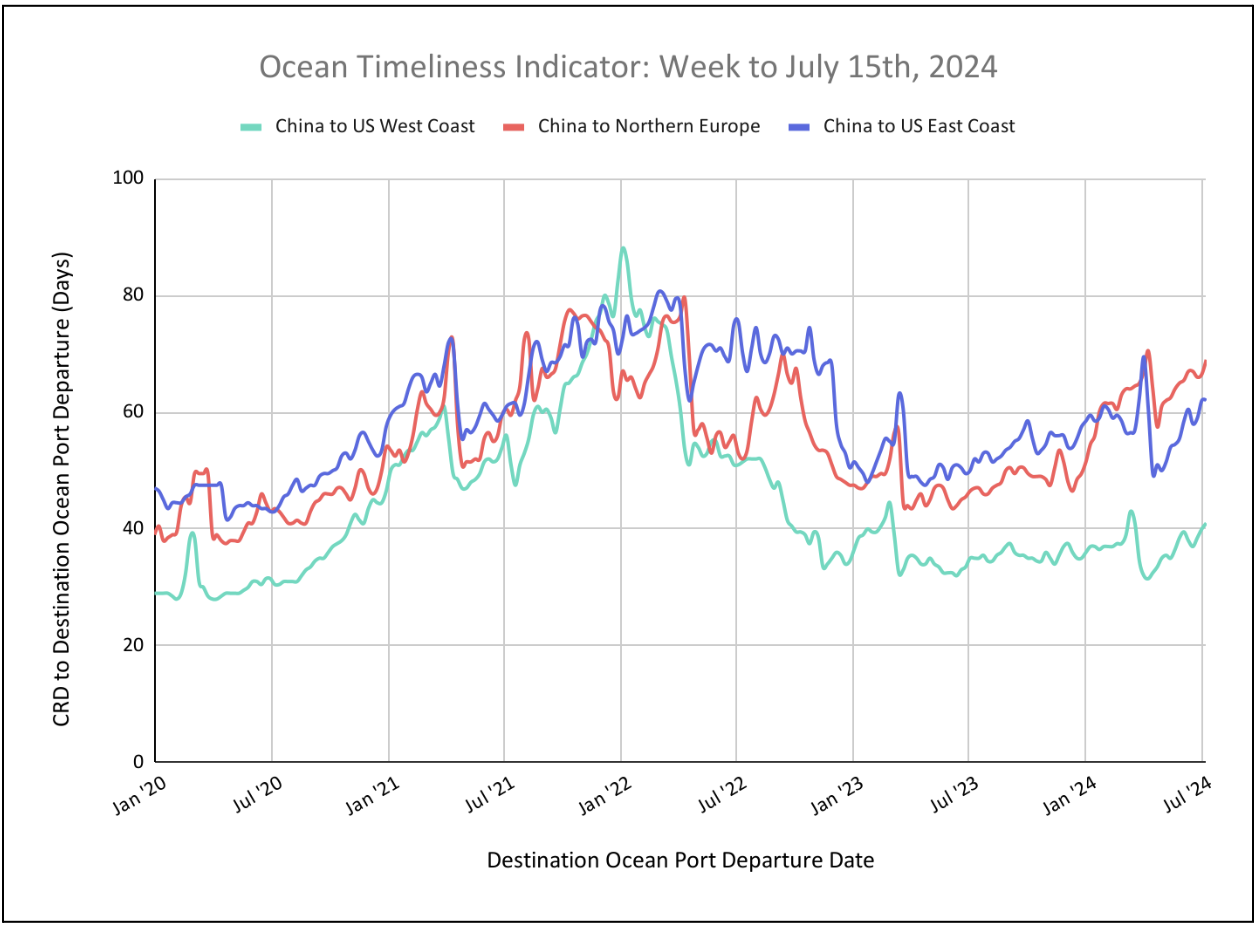
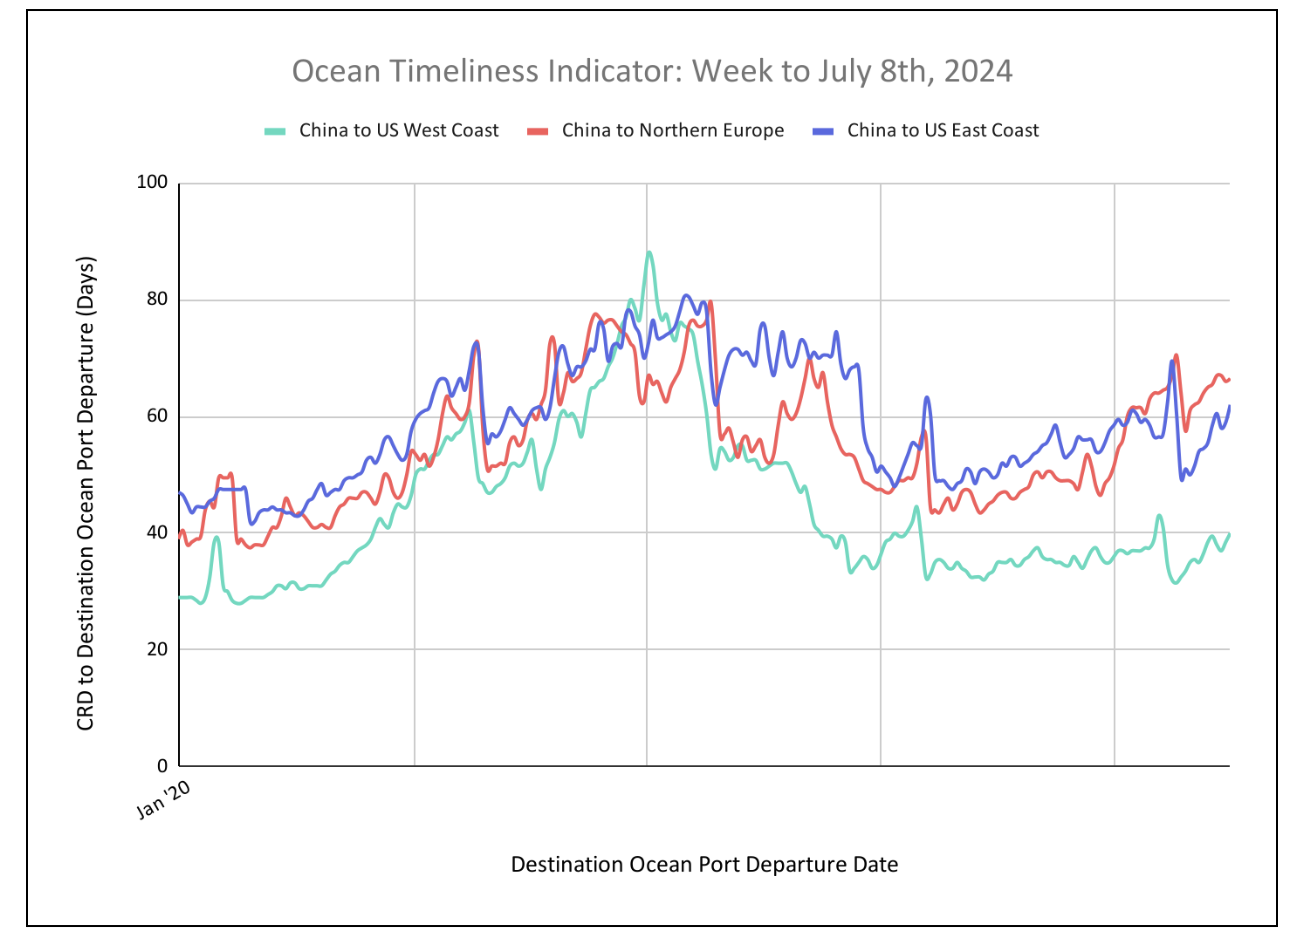
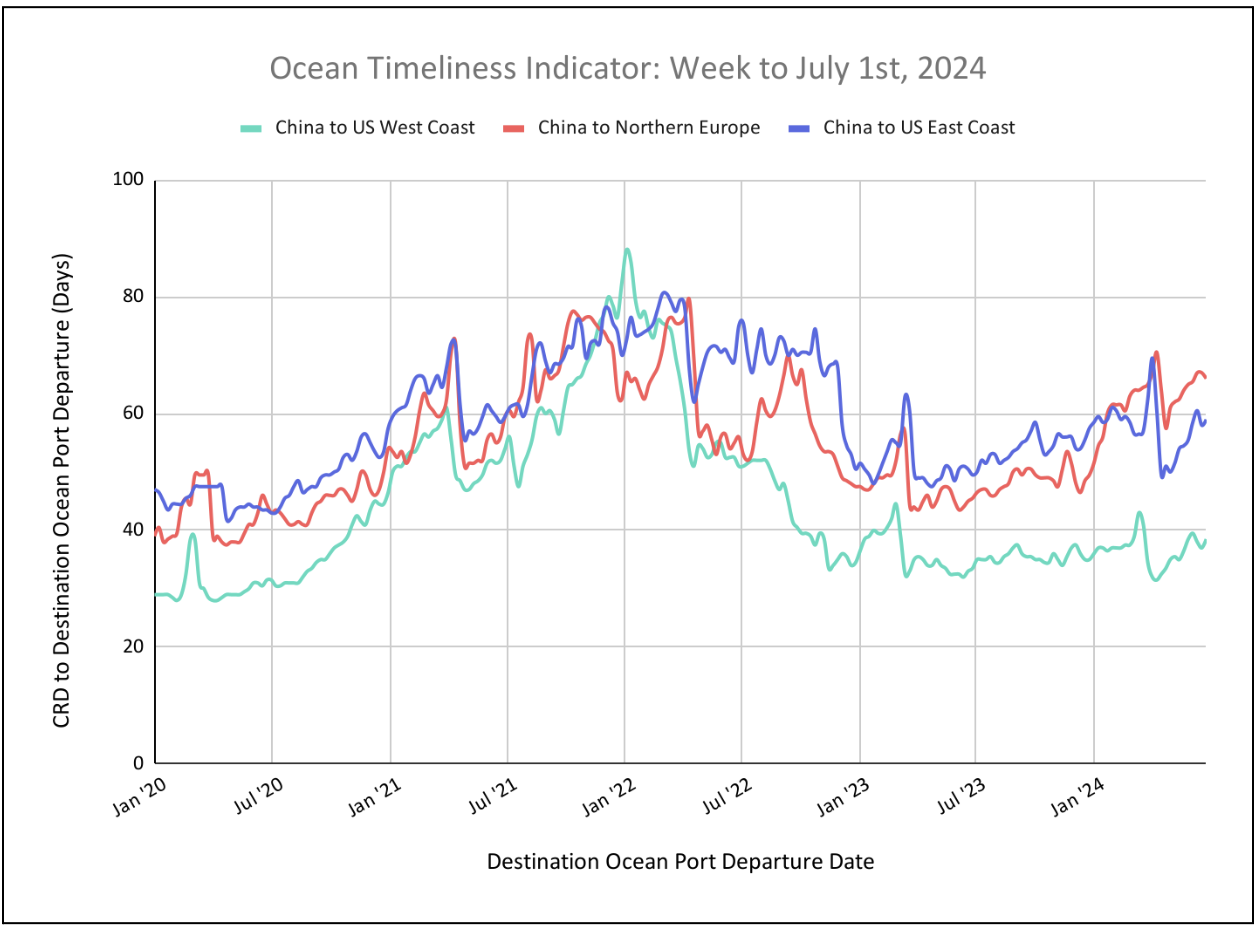
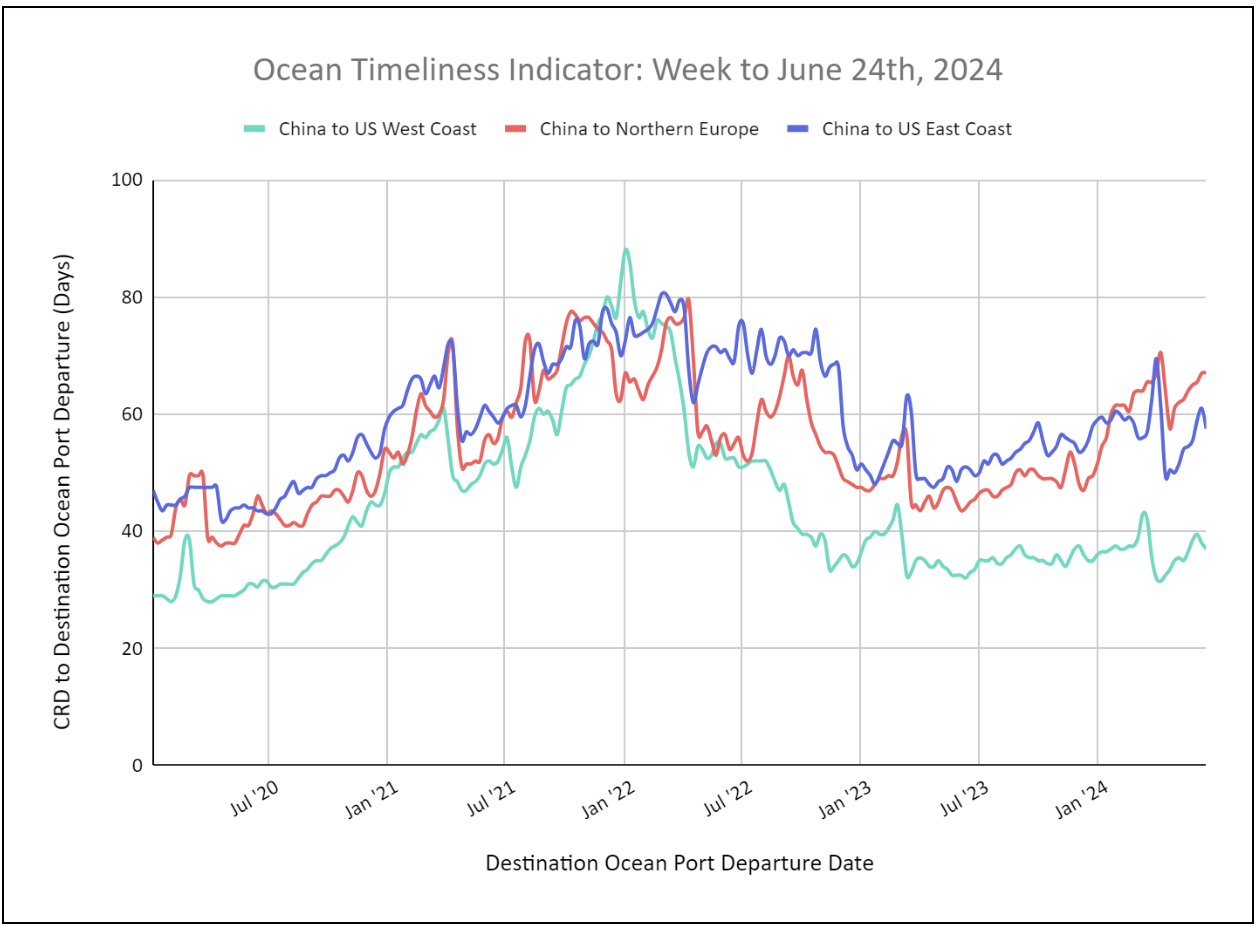
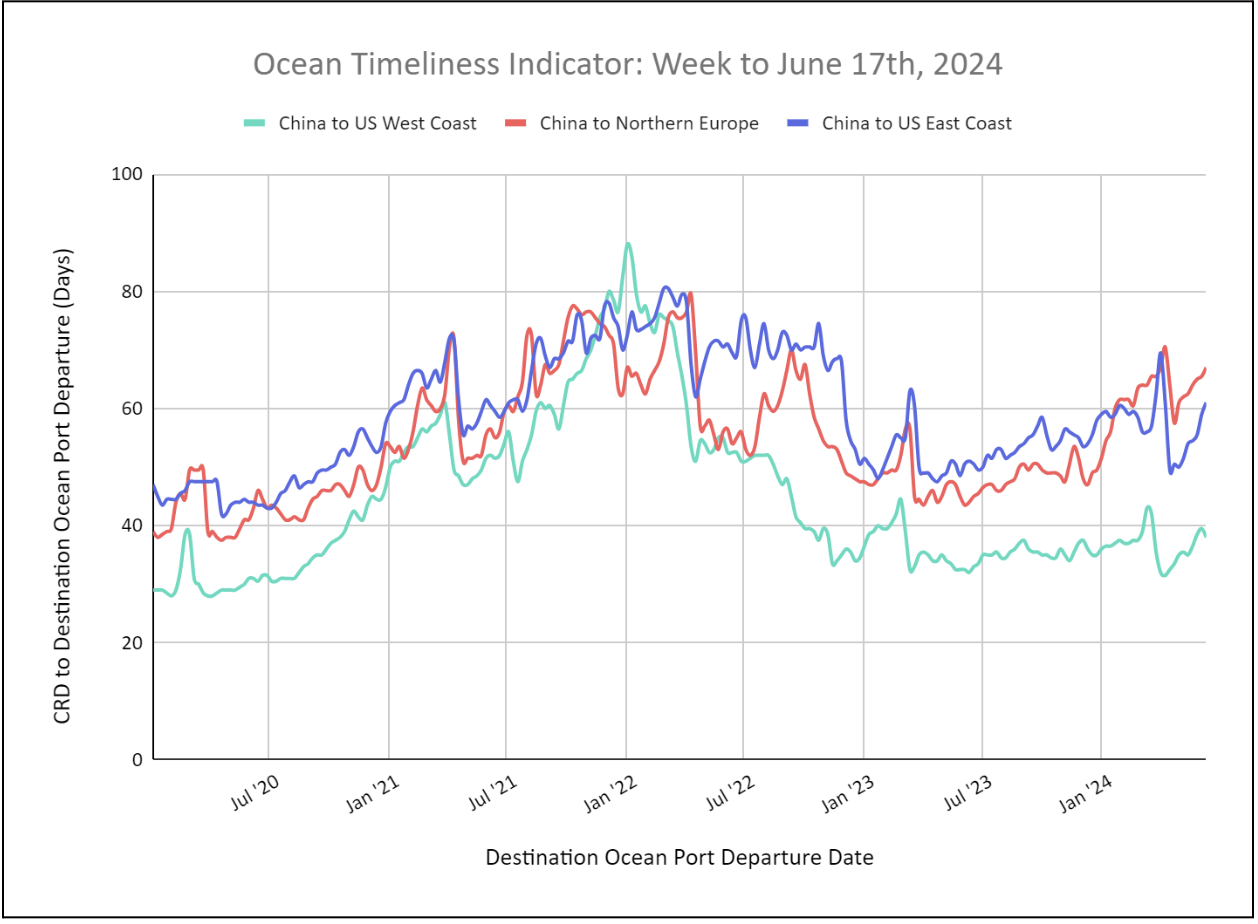
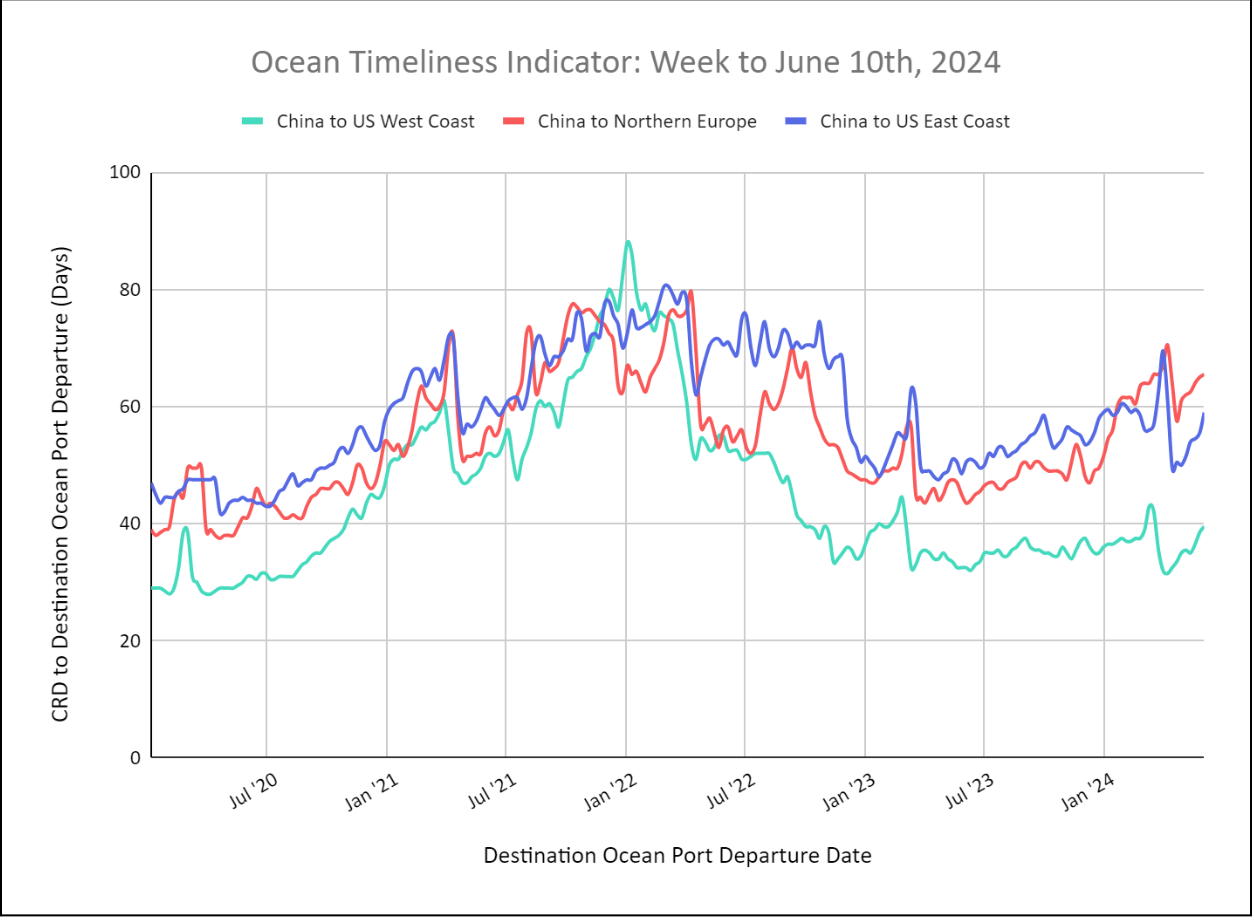
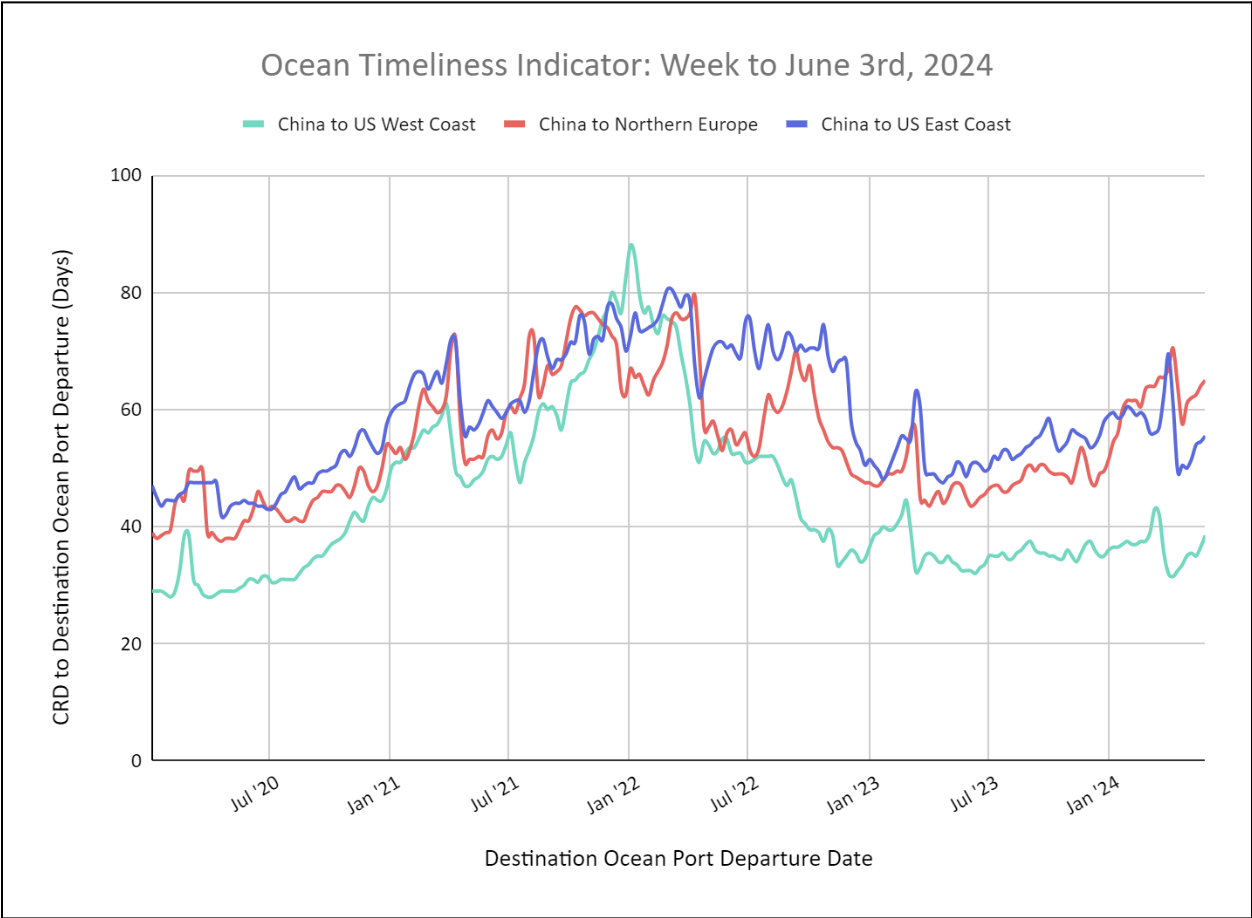
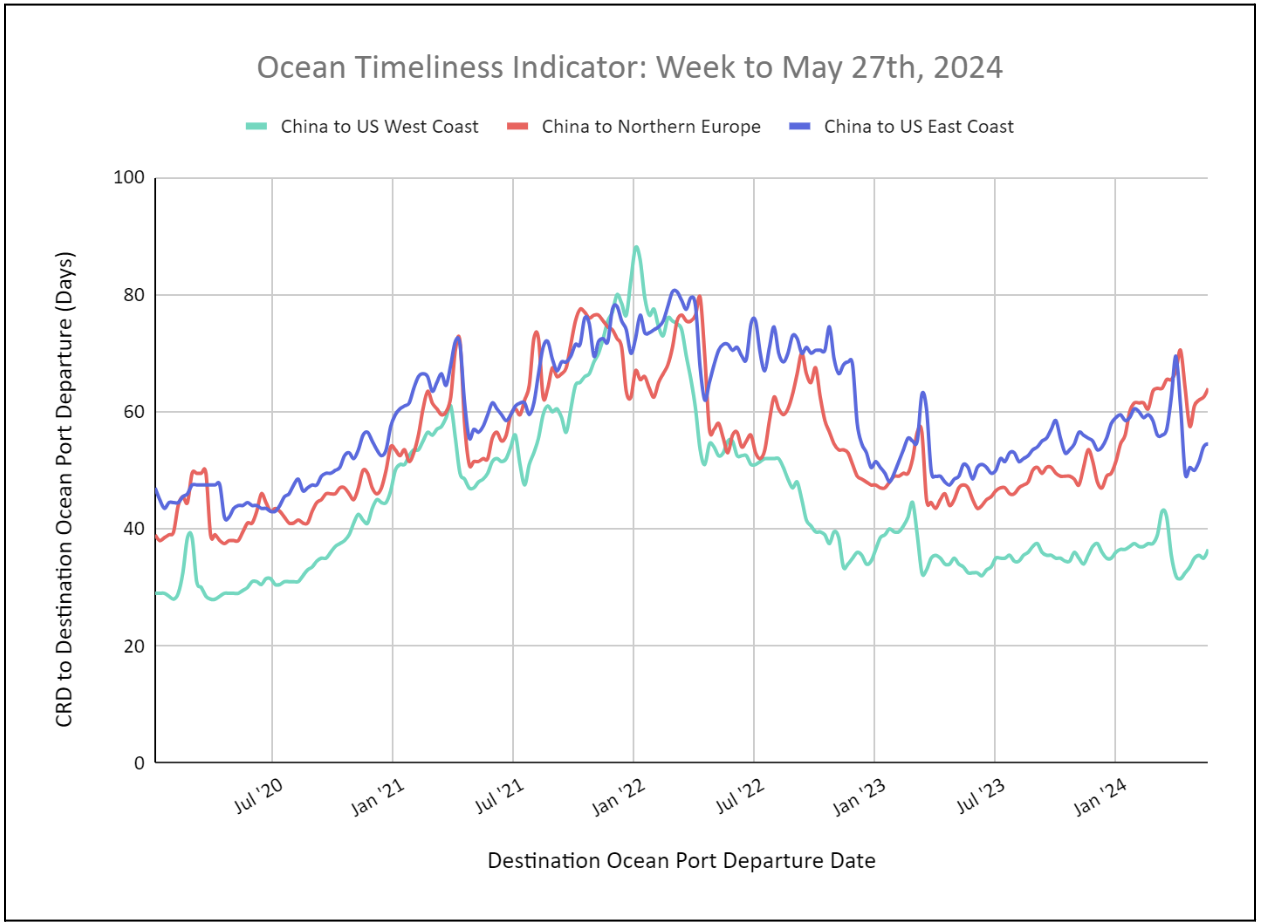
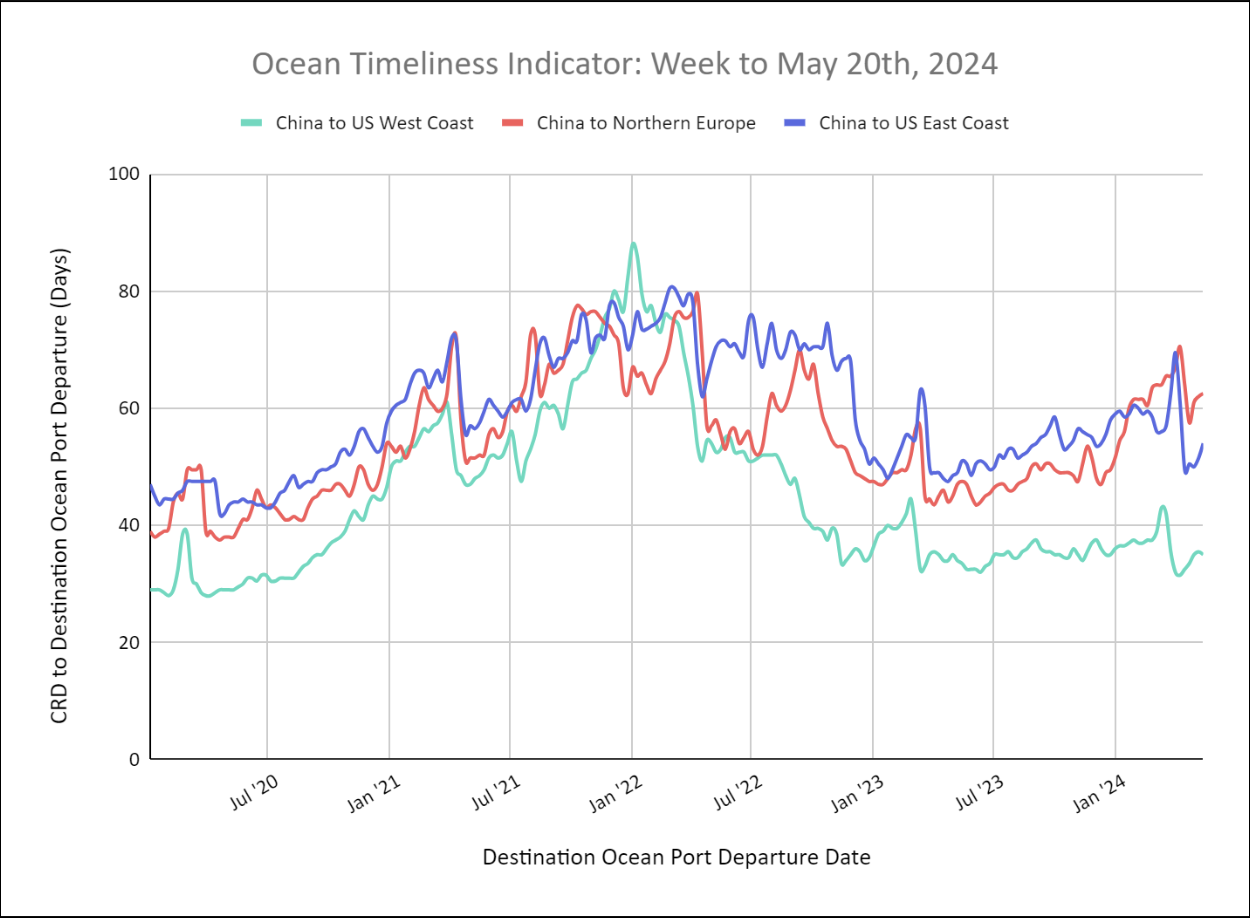
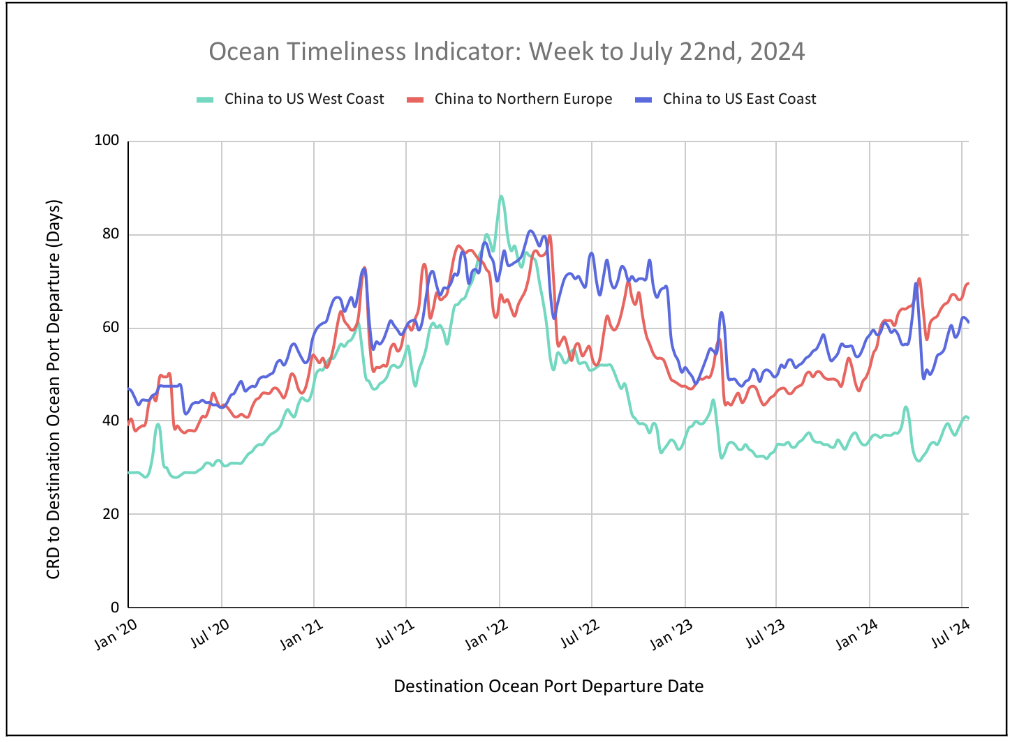
Flexport Ocean Timeliness Indicator
Ocean Timeliness Indicators stabilize for China to the U.S. West Coast and China to Europe, while decreasing for China to the U.S. East Coast.
Week to July 22, 2024
This week, the Ocean Timeliness Indicator for China to the U.S. East Coast and China to the U.S. West Coast have decreased, falling from 62 to 61 days and from 41 to 40.5 days, respectively. Meanwhile, the OTI for China to Northern Europe increased, rising from 69 days to 69.5 days. The reason? European port congestion is nearing pandemic highs, while previous delays caused by extreme weather around the Cape of Good Hope pose ongoing challenges.
Please direct questions about the Flexport OTI to press@flexport.com.
See the full report and read about our methodology here.
The contents of this report are made available for informational purposes only. Flexport does not guarantee, represent, or warrant any of the contents of this report because they are based on our current beliefs, expectations, and assumptions, about which there can be no assurance due to various anticipated and unanticipated events that may occur. Neither Flexport nor its advisors or affiliates shall be liable for any losses that arise in any way due to the reliance on the contents contained in this report.