

Freight Market Update: March 21, 2024

值得关注的趋势

[Air – Global] (Data Source: WorldACD/Accenture)

  • Dubai to Europe air cargo tonnages have seen a substantial increase, with a +205% rise compared to last year and a +7% increase from the previous week, driven by disruptions in Asia-Europe container shipping while overall global demand stabilized.
  • Key Asia-Europe sea-air hubs, including Dubai, Colombo, and Bangkok, have experienced significant air cargo demand to Europe since early 2023, with Dubai-Europe tonnages more than doubling year-on-year due to the Red Sea situation.
  • While Bangkok to Europe demand continues to rise, with a +33% year-on-year increase in week 10, Colombo to Europe demand shows signs of softening, with a growth of +20% compared to +35% the previous week.
  • Globally, air cargo tonnages stabilized with a slight increase in average rates to $2.32 per kilo in week 10, following a post-Lunar New Year recovery in demand, particularly from the Asia Pacific region.
  • Worldwide air cargo capacity is up by +9% year-on-year, with significant increases from Asia Pacific and Central & South America, while average rates remain above pre-COVID levels, indicating a robust recovery in the sector.

[Ocean - FEWB]

  • Asia-North Europe: For Asia-Europe trade, most vessels continue to reroute via the Cape of Good Hope. Some carriers are investigating the possibility of routing back to the Suez Canal, but so far no further announcements. The news indicates that vessels in the Indian Ocean and the Cape of Good Hope may also be impacted by the situation. We’re closely monitoring and following up with carriers.
  • After Maersk & Hapag Lloyd announced the Gemini Cooperation commencing in 2025, Ocean Alliance (CMA CGM Group, COSCO Shipping, Evergreen, and OOCL) confirmed the renewal of The Ocean Alliance partnership for another 5 years. Following the renewal, effective April 2024, there will be some service adjustments. Details to follow once we learn more. So far, the new deployment plan shared by Ocean Alliance for Asia to Europe would be:
    • 6 services between Asia and Northern Europe.
    • 4 services between Asia and the Mediterranean.
  • The floating market rate keeps dropping. Some carriers are preparing to implement GRI for April by $600-800 per FEU. While demand remains flat at the moment, more discussion is ongoing about current offerings and long-term finalizations, especially if the current Red Sea Surcharges will be upheld by carriers.

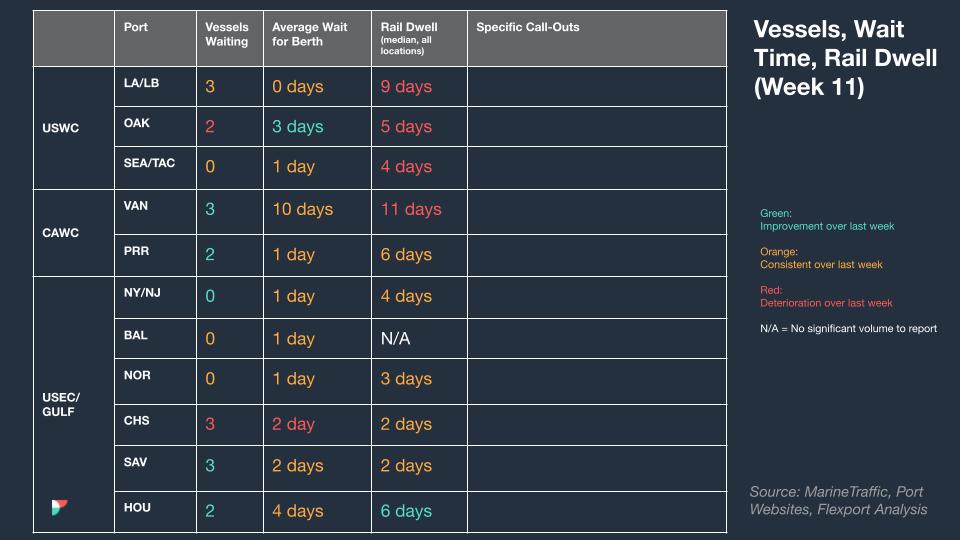
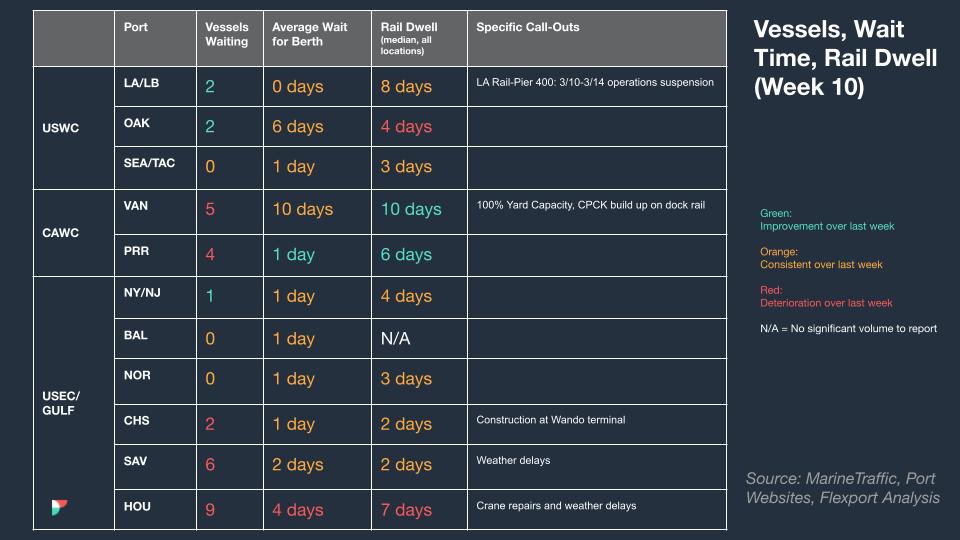
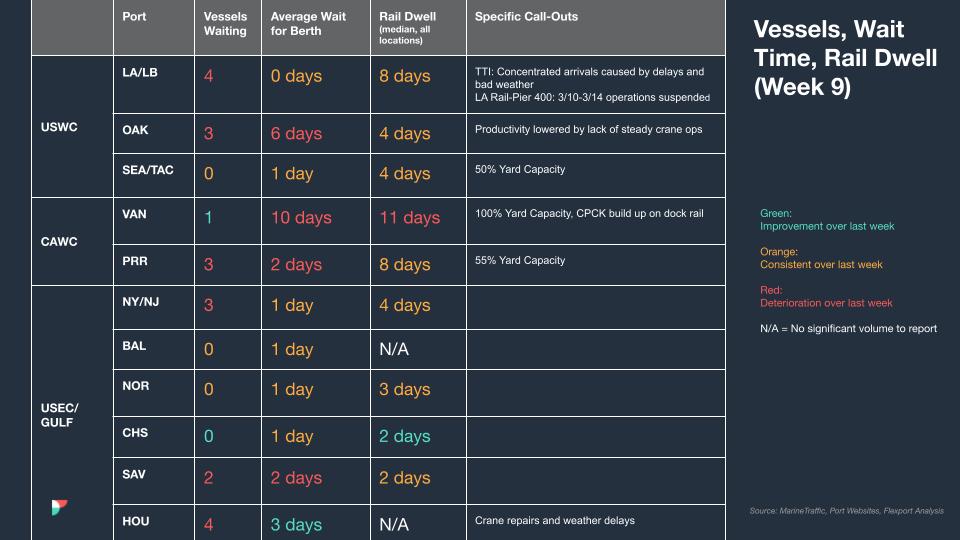
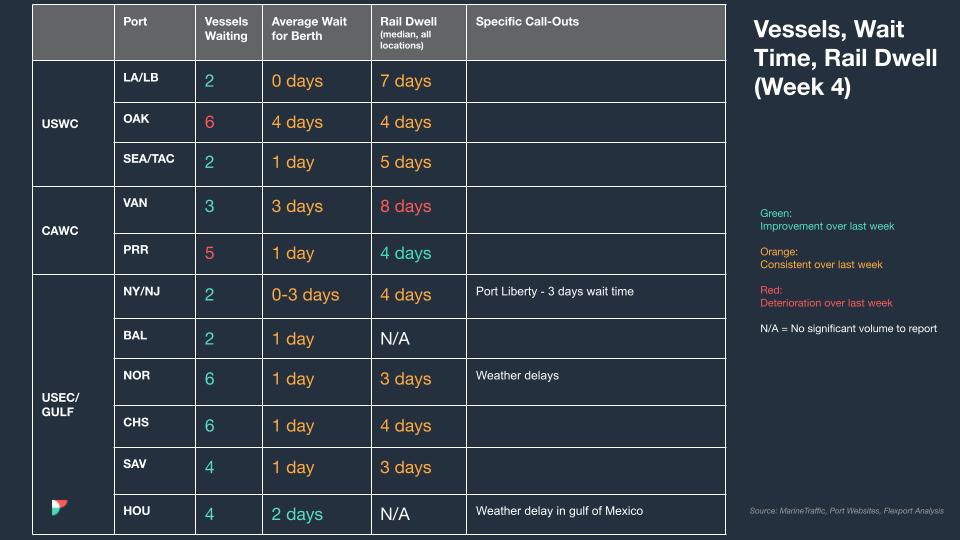
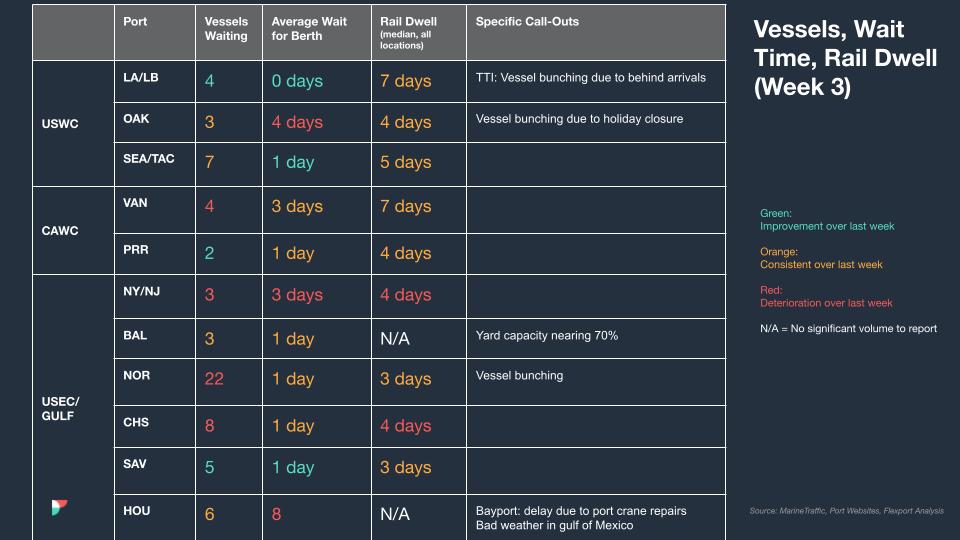
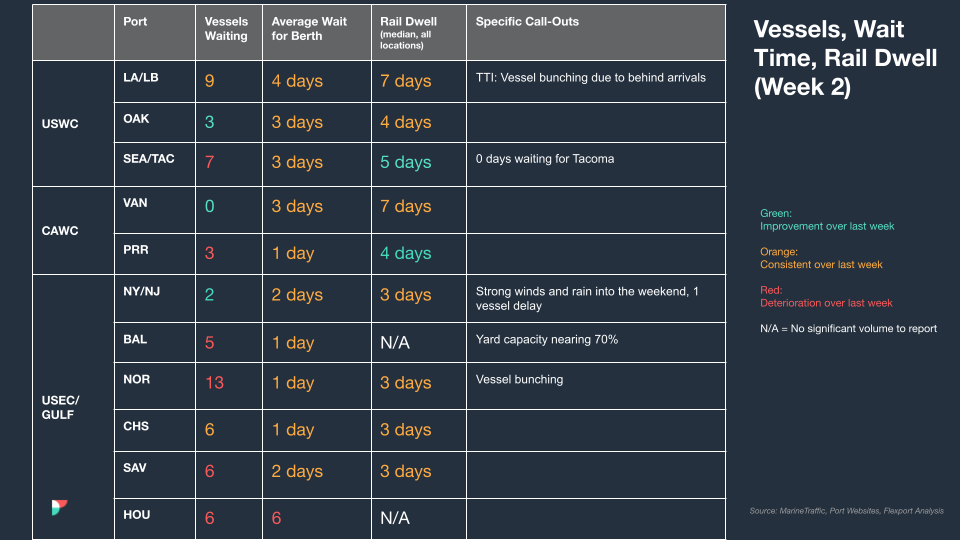
北美船舶停留时间
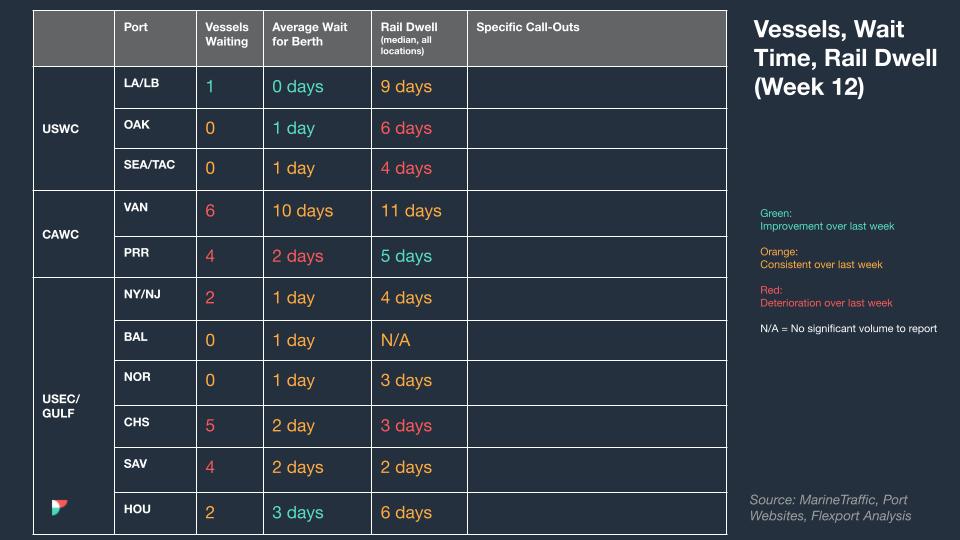
 

标记图像

柔性海运及时性指标

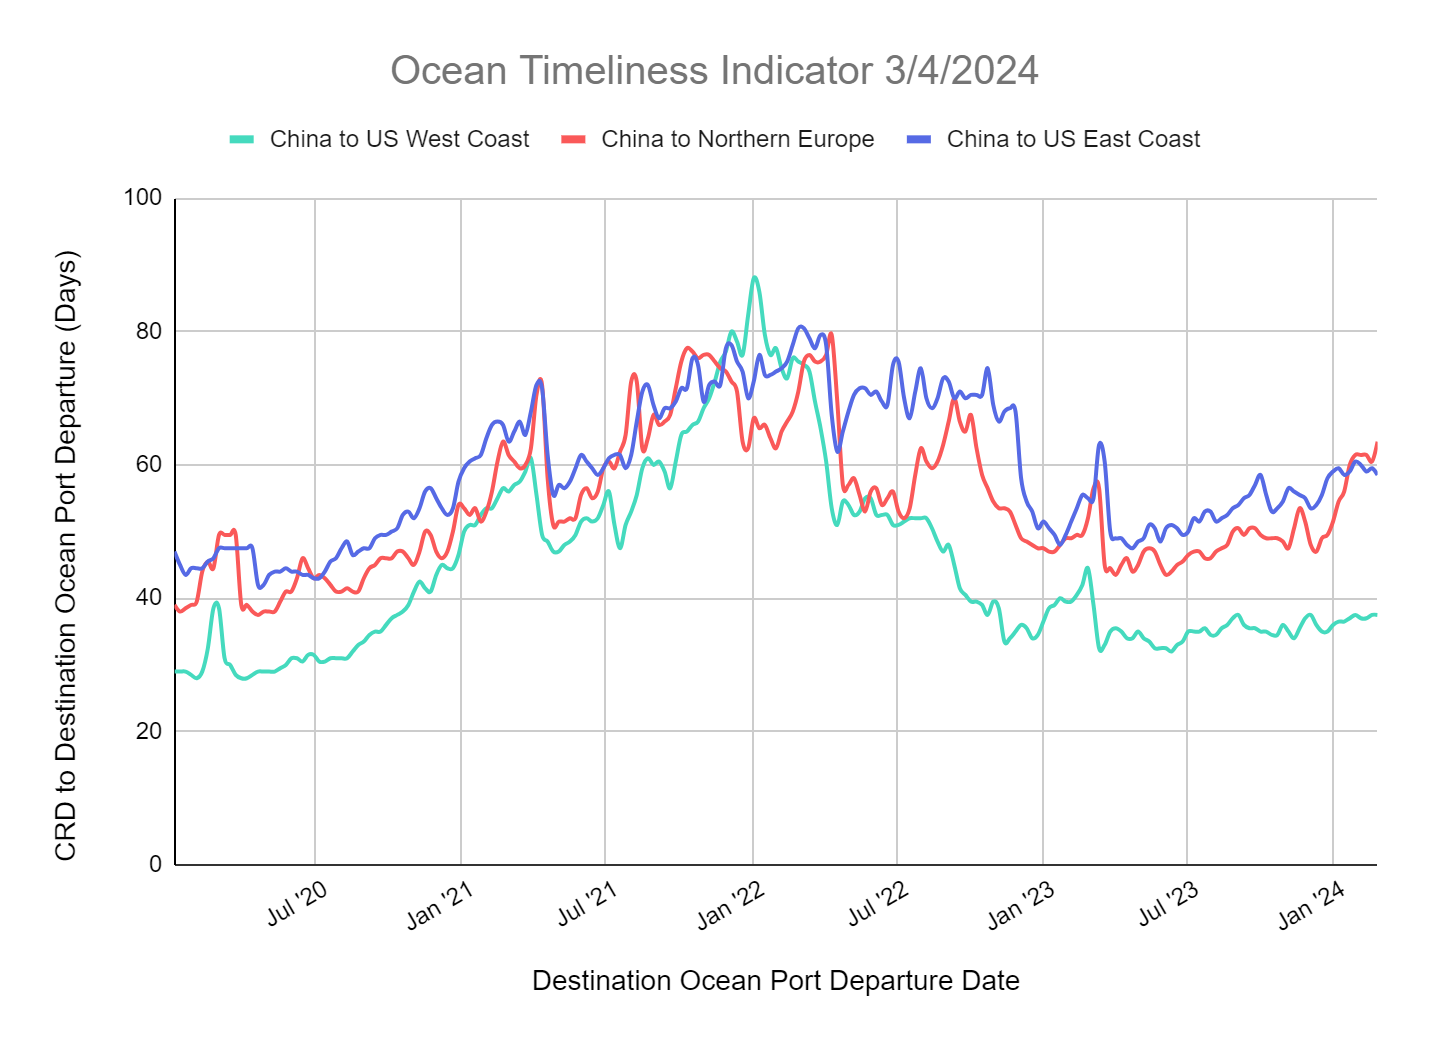
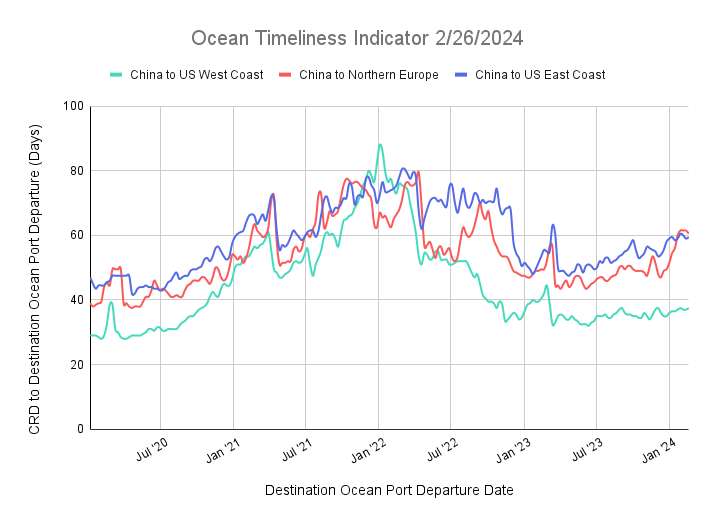
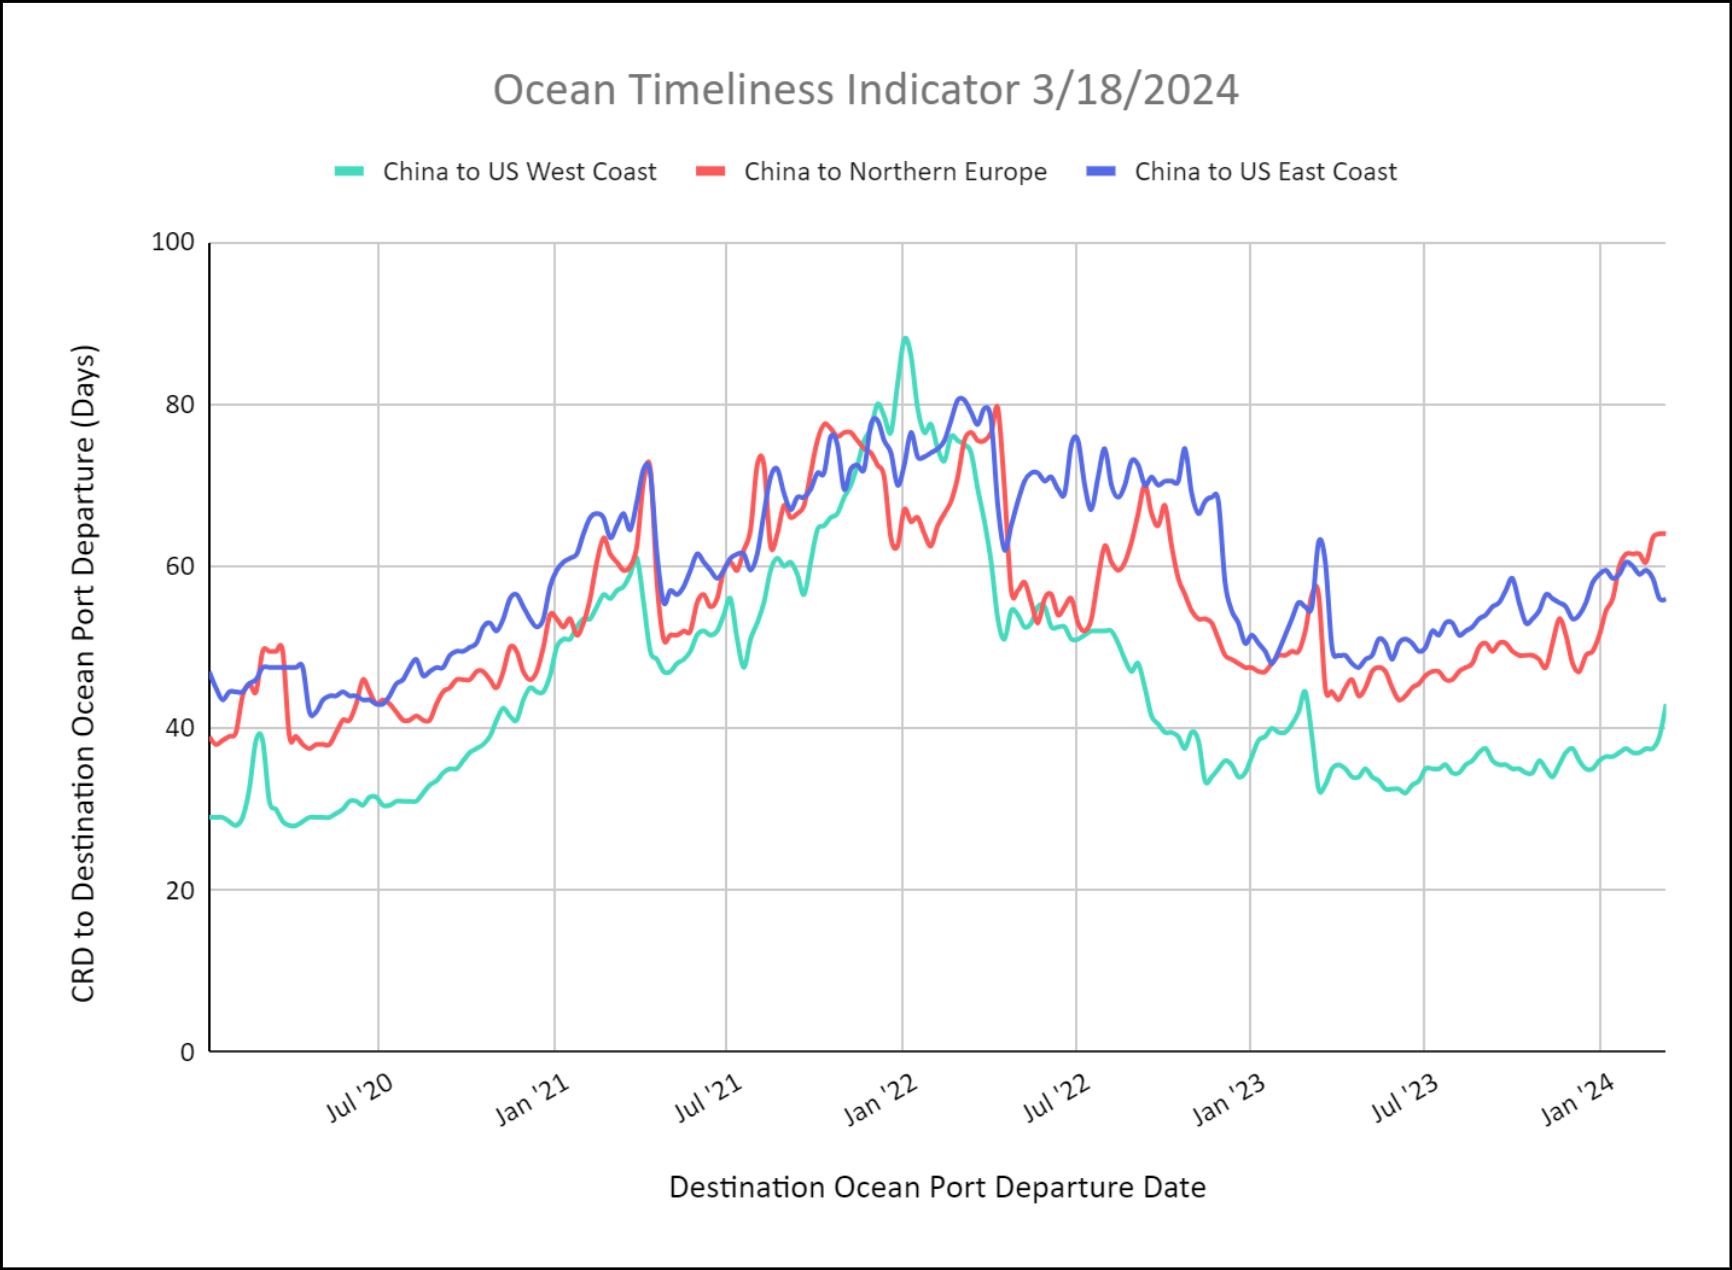
Ocean Timeliness Indicators for China to Northern Europe and China to the U.S. East Coast Remain Steady. Indicators for China to the U.S. West Coast Increase.

Week to March 18, 2024

This week, the OTI for China to Northern Europe remains steady at 64 days due to carrier re-routings from the Suez Canal around the Cape of Good Hope. The OTI for China to the U.S. East Coast also remains elevated, yet steady, at 56 days as some carriers route westward around Cape of Good Hope while most have decided to use the Panama Canal despite continued slot restrictions. The OTI for China to the U.S. West Coast increased to 43 days.
 

标记图像
来源于 Flexport.com

Freight Market Update: March 14, 2024

TPM24 Takeaways

There is no better chance to learn about the state of the industry than the annual Transpacific Maritime (TPM) Conference. TPM ‘24 took place between March 3-6 at the Long Beach Convention Center. Flexport’s team was on site to chat with, and learn from, our customers and carrier partners—both current and potential. Here are our top insights for the coming year.

  • Uncertainties Persist. The supply chain is getting more complex every day. The situation in the Red Sea was top of mind at TPM, as well as Panama Canal restrictions, and ILA contract negotiations. Uncertainty drives anxiety. As a global logistics platform, we can help de-risk the supply chain for our customers and give actionable, data-driven advice on how to manage your procurement decisions in 2024 and beyond.
  • Diversifying means protection. In previous years, shippers and service providers would get into a meeting room and already know exactly what the rates would be. Everyone would sign the contract, and the following year, sign the same contract again. That’s no longer the case. With this market’s persistent uncertainty over the past few years, customers are starting to embrace how diversifying their carrier and forwarder portfolio can foster more agility. For example, larger customers are willing to embrace different routings to ensure disruptions don’t impact their business too strongly. Shippers are also looking for unique ways to keep their business moving, and really understanding how forwarders and brokers can create opportunities and solutions for better protection when moving supplies globally.
  • Technology and visibility are the future. Customers are excited about technology and modernization. Current and potential customers had a lot of questions about integrations, and almost every shipper we spoke with is looking for real-time, accurate shipment and SKU-level visibility. Everyone is data-hungry and looking for solid solutions. Having visibility into your goods is not just critical for managing an efficient, modern supply chain; visibility helps shippers — Flexport’s customers — improve the customer experience for their own customers, too. Visibility is foundational to managing customer expectations as consumers want to know when they’ll receive their goods, and if they’re delayed, why.
  • Relationships matter. Shippers are looking for partners. After the last few years and the tumultuous supply chain we’ve experienced, now more than ever people are looking for good relationships and the ability to talk to someone they trust. There are a lot of questions about the future, and customers are looking for great advice on how to navigate tumultuous waters together. Many of our customers are asking how we handled the disruptions in the past and how we thought outside of the box. It’s important to be nimble and agile with a purpose to provide efficient solutions.

The Year Ahead
After TPM, rates get locked and RFP season goes into full gear. To ensure you feel confident about forecasts for the year ahead before launching your RFPs, don’t hesitate to reach out to your Flexport account managers and our teams to discuss strategies for Fixed/Floating, and BCO/NVO volume contracts.

值得关注的趋势

[Air – Global] (Data Source: WorldACD/Accenture)

  • Overall Growth in Demand: The first two months of the year saw a +13% increase in worldwide air cargo demand compared to the same period last year, driven by strong performance from Middle East & South Asia (MESA) origins and recovery from the Lunar New Year (LNY) seasonal dip.
  • February’s Performance: Preliminary figures for February indicate an +8% year-on-year increase in air cargo tonnages, with a +4% increase when adjusting for the leap year day. This follows a +17% increase in January, showcasing a consistent upward trend despite the complications of comparing months due to LNY variances.
  • Post-LNY Recovery: Three weeks after the later Lunar New Year in 2024, demand had largely rebounded from the post-LNY dip, especially in the key Asia Pacific region, mirroring patterns from 2023 but with somewhat stronger demand in 2024.
  • Regional Dynamics: Strong rebounds were observed in intra-Asia Pacific traffic, up by +44% in Weeks 8 and 9 compared with Weeks 6 and 7, and significant year-on-year growth in tonnages from MESA in the same weeks (+22%), reflecting continued disruption in sea-air shipping routes due to the situation in the Red Sea.
  • Global Pricing and Capacity Trends: Despite a global average rate decline of -16% compared to last year, rates from MESA are up +13%, indicating a regional anomaly. Global air cargo capacity is up by +9% over last year, with notable increases from Asia Pacific and Central & South America, highlighting an overall growth in the air cargo industry above pre-COVID levels.
  • Average global rates remain above pre-COVID levels (+27% compared to February 2019).

[Ocean - FEWB]

  • Asia-North Europe: The Red Sea situation continuously impacts freight market developments. Some vessels continue to reroute via the Cape of Good Hope, and some carriers are investigating the situation and re-routing back via the Suez Canal. More to follow as information becomes available.
  • Demand is flat, and carriers are further adjusting rates for more fresh cargo in 2H March. Carriers are still upholding PSS/Contingency Surcharges due to rerouting vessels, however, more questions about the actual additional cost are being brought up and further adjustments are expected in April.
  • Carriers are actively investigating demand & supply. We’re seeing vessels open for booking till last minute, which may reflect the oversupply situation. If soft demand continues from Week 12 onwards, we expect there could be more blank sailings announced soon.
  • For historical updates on the Red Sea situation, read more in Global Ocean Carriers Halt Red Sea Transits – What to Expect.

北美船舶停留时间


标记图像
来源于 Flexport.com

Freight Market Update: March 7, 2024

值得关注的趋势

[Air – Global] (Data Source: WorldACD/Accenture)

  • Global air cargo tonnages increased in the last full week of February following the typical dip during the Lunar New Year (LNY), with significant surges in tonnages at key Asia-Europe sea-air hubs (Dubai, Colombo, Bangkok) due to disruptions in container shipping in the Red Sea.
  • Dubai-Europe air cargo traffic in week 8 saw a more than double increase (+146%) compared to the same period last year, with recent weeks showing a +140% year-on-year (YoY) rise. Colombo-Europe and Bangkok-Europe also experienced significant YoY tonnage increases, indicating strong demand for air cargo as an alternative to disrupted sea routes.
  • The sustained high demand for air cargo through these hubs into March is uncertain, but week 8 showed no signs of waning, contributing to a +9% week-on-week rise in global air cargo tonnages, partially recovering from previous drops during LNY.
  • A broader two week comparison highlights the impact of LNY and Valentine’s Day on demand, with significant tonnage decreases from Asia Pacific and Central & South America, but a notable rise from the Middle East & South Asia region. Global average prices fell by -6% due to these fluctuations, despite a price rise from the Middle East & South Asia.
  • Year-on-year data reveals a -4% decrease in worldwide tonnages for weeks 7 and 8, with a significant drop ex-Asia Pacific but a notable increase ex-Middle East & South Asia. Average global rates remain above pre-COVID levels, though they have decreased compared to the previous year, with worldwide air cargo capacity significantly up (+8%).

[Ocean - FEWB]

  • The Red Sea Crisis is continuously impacting freight market development. With most of the vessels routed via the Cape of Good Hope, carriers believe the supply will still be balanced with demand in a mid-run. The Lunar New Year (LNY) soft demand is temporary, however, equipment is in better shape (mainly because of LNY slow recovery). Carriers are also investigating the situation and re-routing back via the Suez Canal. More details to follow as information is made available.
  • Demand remains flat post LNY. Carriers are further adjusting rates to cater fresh cargo in 1H March. PSS/Contingency Surcharges are still being upheld by carriers due to the reroute, however, more questions about the actual additional cost are being brought up and we expect there will be adjustments in March.
  • Ocean Alliance continuously announced voided plans for March. With 2M’s Winter Program ending, carriers are actively investigating the demand & supply. If soft demand continues from Week 12 onwards, we expect there may be more blank sailings announced.
  • To mitigate the disruption of operational challenges (sailing schedule adjustments, vessel downsizes, equipment shortages, rollover, etc.), shippers can consider premium services offered by liners with higher costs. This approach will help guarantee space and equipment and shorten delays.

北美船舶停留时间


标记图像

New! Flexport Ocean Timeliness Indicator

Ocean Timeliness Indicators for China to Northern Europe Increase While China to U.S. East/West Coast Stabilize

Welcome to the new Ocean Timeliness Indicator! Due to ongoing global shipping events in the Panama and Suez Canal, we have refined our previous report by splitting the Transpacific Eastbound trade lane into two subtradelanes: TPEB to the U.S. West Coast, and TPEB to the U.S. East Coast.

The Methodology: The Flexport Ocean Timeliness Indicator (OTI) utilizes data from Flexport’s ocean shipping operations for an expansive view of the cargo’s journey. Updated on a weekly basis, the Flexport OTI shows the transit time from the cargo ready date at the exporters’ factory or warehouse to the containers’ departure from the destination ocean port. The ocean shipping world tends to run along “trade lanes.” The three biggest east-west trade lanes carry goods from Asia to the U.S. West Coast, Asia to the U.S. East Coast, and from Asia to Northern Europe. The OTI captures the timeliness of each. As there are many transit time nuances from port to port and service to service, to show accurate trends, the OTI uses the following logic:
– Excludes premium services
– Displayed transit times are based on a trailing two-week median
– Major origin and destination ports are used as a proxy for the overall trade lane to create clear trends. Other origin or destination ports will have additional transit time considerations based on ocean carrier services.
*- Asia to U.S. West Coast trade lane uses the China ports of Shanghai and Ningbo and the U.S. West Coast ports of Los Angeles/Long Beach.
– Asia to U.S. East Coast trade lane uses the China ports of Shanghai and Ningbo and the U.S. East Coast ports of New York/New Jersey and Norfolk.
– Asia to North Europe trade lane uses the China ports of Shanghai and Ningbo and the North Europe port of Rotterdam.

Week to March 4, 2024

This week, the OTI for China to Northern Europe increased to 63 days due to carrier re-routings from the Suez Canal to the Cape of Good Hope. These transit times have begun to normalize but will change when carriers decide to transit the Red Sea again. The OTI for China to the U.S. East Coast remains elevated at 59 days as some carriers route westward around Cape of Good Hope while most leverage the Panama Canal despite slot restrictions. The OTI for China to the U.S. West Coast remains at 37 days as the transit time impact from the Red Sea situation is minimal.


标记图像


Please direct questions about the Flexport OTI to press@flexport.com.

See full report here.

本报告内容仅供参考。Flexport 不对本报告中的任何内容作出保证、陈述或担保,因为这些内容是基于我们当前的信念、预期和假设,而由于可能发生的各种预期和非预期事件,我们无法对这些内容作出保证。Flexport 及其顾问或附属机构均不对因依赖本报告所载内容而以任何方式造成的任何损失承担责任。

来源于 Flexport.com

Freight Market Update: February 29, 2024

值得关注的趋势

[Air – Global] (Data Source: WorldACD/Accenture)

  • Strong Surge in Tonnages at Asia-Europe Sea-Air Hubs: Recent weeks have seen a notable increase in air cargo volumes at key Asia-Europe sea-air hubs such as Dubai, Colombo, and Bangkok, driven by shippers seeking alternatives to container shipping disruptions due to attacks on ships in the Red Sea. This surge is attributed to the need to replenish European stocks affected by longer container ship voyages around the Cape of Good Hope.
  • Significant Year-on-Year Growth: Analysis highlights a year-on-year increase in air cargo tonnages to Europe from Dubai (+71%), Colombo (+61%), and Bangkok (+58%) in the first seven weeks of 2024, significantly outpacing growth at other hubs like Singapore and Doha.
  • Impact of Lunar New Year Timing: The later occurrence of Lunar New Year (LNY) in 2024 complicates week-by-week comparisons but underscores a clear pattern of increased tonnages from these hubs to Europe. Despite this, the impact on pricing remains uncertain due to various factors, including market-wide declines from the previous year.
  • Seasonal Demand Fluctuations: Post-LNY, a traditional decline in demand from Asia Pacific is observed, affecting global air cargo tonnages and rates. However, there’s a structural improvement in demand compared to the previous year, with specific regions like the Middle East & South Asia experiencing tonnage and rate increases, likely reflecting the shift from ocean freight to sea-air solutions.
  • Global Air Cargo Trends: Overall, despite a slight year-on-year decrease in worldwide tonnages for weeks 6 and 7, structural improvements in demand levels are evident. Notably, worldwide air cargo capacity has increased, with significant rises from Asia Pacific and Middle East & South Asia, indicating a robust recovery and adaptation within the air cargo industry to ongoing logistical challenges.

[Ocean – ISC to North America]

  • Rates: Reduced down after the 2H February GRI. Carriers had initially posted a March 1st GRI of $1000/container, but as of this week have postponed it until 2H March. Without any changes to the market it is likely the GRI will be canceled entirely.
  • Space: Vessels delayed getting to destination and back to origin are resulting in a lack of capacity. The short term disruption is expected to be more challenging, while longer term we expect some normalization due to new builds, faster vessel speeds, and implementation of idle capacity.
  • Equipment: Although equipment availability is carrier-specific for each port of loading, the overall situation is challenging. This is especially true at inland container depots and smaller/less connected ports.

[Ocean - FEWB]

  • Red Sea: This remains unresolved as most vessels continue to reroute via the Cape of Good Hope, adding 2-4 weeks of transit time (round trip). Vessel schedules will continue to fluctuate as a result, and regional equipment shortages will occur in some Asian ports.
  • Demand: Demand has softened as expected after the LNY holiday. Bookings have slowed down in week 9; we expect them to pick up from week 11 onwards. As roll pools have been created in the past few weeks, vessel utilization is positive at the moment, and carriers are continuing to assess capacity and rates.
  • Capacity: All alliances implemented massive blank sailings pre-LNY for weeks 8 and 9, which cut about 30+% of capacity on average. After the LNY holiday, Ocean Alliance announced two more void plans for March. If demand remains flat, there might be more blank sailings to be announced. Occasional space constraints due to smaller vessel deployment and schedule re-shuffling due to current re-routing will also impact the available capacity each week.
  • Rate Development: As the Red Sea situation continues to impact capacity and equipment, carriers are upholding rates via GRI / PSS / Contingency Charges, however there’s pressure and questions about the amount of additional costs of re-routing via Cape of Good Hope. Expectations are that the Peak Season quantums will be mitigated or even be dropped in March. Rates are expected to go down as of March 1 and continue to decline going forward due to low demand.

请与您的客户代表联系,了解货运所受影响的详情。

北美船舶停留时间


标记图像

New! Flexport Ocean Timeliness Indicator

Due to ongoing global shipping events in the Panama and Suez Canal, we have refined our previous report by splitting the Transpacific Eastbound trade lane into two subtradelanes: TPEB to the U.S. West Coast, and TPEB to the U.S. East Coast.

Ocean Timeliness Indicators for China to Northern Europe and China to U.S. East/West Coast Stabilize

Week to February 26, 2024

This week, the OTI from China to Northern Europe due to the Suez Canal Crisis remains high above 60 days. We anticipate these transit times have begun to normalize at these new highs as vessels sail around the Cape of Good Hope. The OTI for the China to U.S. East Coast remains steady at 59 days as does the OTI for China to the U.S. West Coast at 37 days.


标记图像


The Methodology: The Flexport Ocean Timeliness Indicator (OTI) utilizes data from Flexport’s ocean shipping operations for an expansive view of a container’s journey. Updated on a weekly basis, the Flexport OTI shows the time taken to transit from the Cargo Ready Date at the exporters’ gate to the Destination Port Departure date when products are ready to leave port to go to importers. The ocean shipping world tends to run along “trade lanes.” The three biggest trade lanes carry goods from China to the U.S. West Coast of North America, China to the U.S. East Coast of North America, and from China to Northern Europe. The OTI captures the timeliness of each of these. To show the most realistic picture, the OTI will exclude premium services and will utilize a trailing two-week approach.

See full report here.

本报告内容仅供参考。Flexport 不对本报告中的任何内容作出保证、陈述或担保,因为这些内容是基于我们当前的信念、预期和假设,而由于可能发生的各种预期和非预期事件,我们无法对这些内容作出保证。Flexport 及其顾问或附属机构均不对因依赖本报告所载内容而以任何方式造成的任何损失承担责任。

Freight Market Update: February 22, 2024

值得关注的趋势

[Air – Global] (Data Source: WorldACD/Accenture)

  • China’s Inbound Tonnage Decline: In the week leading up to the Lunar New Year, China experienced a significant drop in inbound air cargo tonnages by 15% week-over-week, contributing to a global tonnage fall of 12%. This was against a backdrop of only a 2% decline in China’s outbound tonnages, indicating a sharp contrast in trade dynamics as the holiday approached.
  • Stable to Rising Average Global Rates: Despite the drop in tonnages, average global air cargo rates remained steady and even saw a slight increase during week 6, mirroring trends from the previous year. This suggests resilience in pricing amid fluctuating volumes.
  • Intra-Asia Pacific Market Slowdown: A notable 17% fall in intra-Asia Pacific traffic largely drove a 3% global tonnage decline, highlighting the region’s quick response to the Lunar New Year compared to long-haul markets. Conversely, tonnages from Asia Pacific to certain regions like Central & South America increased, demonstrating varied market reactions.
  • Year-on-Year Tonnage and Capacity Increase: Comparatively, weeks 5 and 6 saw a 10% increase in worldwide tonnages year-on-year, with significant rises from Asia Pacific and Middle East & South Asia origins. This was accompanied by a substantial 16% increase in global air cargo capacity, indicating an overall growth in the air cargo sector from last year.
    Pricing Trends and Pre-Covid Comparison: Despite a year-on-year drop in average worldwide rates by 14%, the gap is narrowing, and rates remain significantly above pre-Covid levels (34% increase compared to February 2019), suggesting a sustained recovery and adaptation in the air cargo market post-pandemic.

[Ocean – ISC to North America]

  • Rates: Increased due to 2H February General Rate Increases (GRIs), but as of week 8 are starting to mitigate. Overall levels still remain significantly inflated compared to November levels at +250% to United States East Coast (USEC) BP and +90% to United States West Coast (USWC) BP.
  • Space: Vessels delayed in getting to destination and back to origin are resulting in a lack of capacity. The short-term disruption is expected to be more challenging, while longer term we expect some normalization due to new builds, faster vessel speeds, and implementation of idle capacity.
  • Equipment: Although equipment availability is carrier-specific for each port of loading, the overall situation is challenging. This is especially true at inland container depots and smaller/less connected ports.

请与您的客户代表联系,了解货运所受影响的详情。

北美船舶停留时间


标记图像

本周新闻

Cargo Diversions To West Coast Have Started, LA Port Director Confirms
Shippers are rerouting their cargo to the West Coast of the United States, particularly to the Port of Los Angeles, to avoid security concerns in the Red Sea and drought-related issues at the Panama Canal. Despite not experiencing a surge in freight, the port has observed an increase in cargo volumes, with January marking the second busiest month on record. Retailers are actively replenishing inventories ahead of Lunar New Year closures, and positive economic indicators suggest continued spending by American households.

Import Demand Growth Robust Leading Into Lunar New Year
Bookings for freight bound for the top four U.S. port complexes had surged compared to last year in the lead-up to the Chinese New Year, particularly from China, prompting a notable shift in the supply chain. This spike in orders signifies a departure from the minimal increase seen last year due to pandemic-related inventory surpluses. The rise in demand, especially in Southern California ports, may be influenced by geopolitical conflicts and disruptions like the Red Sea conflict and drought in Panama. Importers are willing to pay higher rates to ensure timely delivery of goods, indicating potential spring demand.

Freight Shipments And Expenditures See January Declines, Notes Cass Freight Index

The January edition of the Cass Freight Index reveals sequential and annual declines in freight shipments and expenditures. Shipments fell 7.6% annually, continuing a trend from previous months, while expenditures dropped 24.3% annually, following a record surge in 2021 and subsequent increases in 2022. Despite harsh winter weather, the decline in shipments aligns with normal seasonality, indicating a potential improvement in freight trends. ACT Research suggests that with destocking and rising goods consumption, the freight downturn may be nearing its end, anticipating improved freight demand fundamentals in 2024.

Rising Inflation Driving Food Supply Chain Robberies
Food theft in the global supply chain has surged, now comprising a third of all hijacking incidents, with a 29% increase in 2023 compared to 2022 levels, according to the British Standards Institution (BSI). This rise is attributed to thieves targeting basic goods experiencing significant price hikes due to inflation. Notably, food and beverage items now represent 22% of overall theft, with agricultural products accounting for 10%. While thefts from facilities have decreased, thefts from containers or trailers have risen sharply. Lack of secure truck parking is cited as a major factor, with road haulage sectors in Europe being particularly vulnerable.

来源于 Flexport.com

Freight Market Update: February 14, 2024

值得关注的趋势

[Ocean - TAWB]

  • 从 2 月 1 日起,各种费率指数开始显示每 TEU 跳涨约 500 美元。这在意料之中,因为承运商推出了与红海局势有关的附加费(应急附加费、紧急附加费、PSS 等)。
  • 由于欧洲大部分地区(主要是德国南部、波兰和地中海西部地区)的设备变得有限,预计 3 月份的费率将进一步上升。
  • 尽管为了帮助应对红海局势,我们看到了空白航次和在其他贸易航线上重新部署的船只,但运力仍相对稳定。
  • 巴拿马运河干旱问题对 1 月份过境集装箱船的影响同比微乎其微。

[美国出口]

  • 内陆铁路货场和出口装货点的设备(EQ)水平越来越不稳定。请在货物就绪日期 (CRD) 前四周进行预订。如果无法做到这一点,请考虑在沿海港口装载卡车和转运货物,以避免持续的 EQ 问题。
  • 如果货物在沿海港口装船,请提前 2-3 周或更多时间预订,以确保装船优化,避免空船,并确保设备及时到位。
  • 对于跨大西洋东行航线,可提供从基地港到基地港的运力。

[航空 - 全球](数据来源:WorldACD/埃森哲)

  • 中国运费上涨:中国至北美和欧洲的航空货运费率在农历新年前一周分别飙升了 14% 和 8%,但仍低于 12 月初的峰值。
  • 红海海运中断的影响:红海集装箱运输中断可能是导致运价飙升的原因之一,这促使一些从中国运往欧洲的海运货物转为海空联运。
  • 运输需求强劲:尽管目前受到干扰和农历新年的季节性影响,但从中国到欧洲和北美的航空货运需求依然强劲。
  • 全球需求和费率上升:受农历新年影响,全球航空货运需求和费率持续上升,在强劲的电子商务运输支持下,货运吨位同比大幅增加。
  • 全年大幅增长:第 4 周和第 5 周的全球货运量与去年同期相比增长了 25%以上,其中亚太地区、中东和南亚的货运量大幅增长,部分原因是海运转为海空联运。
  • 与 2019 年 2 月相比,房价走势超过 32%。

[拉美航空北上航线]

  • 巴西纳韦甘特斯港正在进行土建工程,以便在 2024 年 1 月 5 日开始的未来两年内调整码头基础设施。工程将分两个阶段进行。在一侧施工的同时,另一侧将继续正常运营。工程将从东侧开始,当这一阶段完成后,工程将转移到西侧。
  • 虽然该港口目前的运营没有受到限制,但在此期间,我们可能会看到通过 Navegantes 的所有服务都将面临运营挑战,等待时间也会增加。一些托运人可能会选择转到附近的港口(伊塔波阿港和巴拉那瓜港)。
  • 达飞轮船公司宣布,他们的 BRASEX 服务将转至因比图巴。另一方面,地中海航运致力于为 Navegantes 以外的客户提供服务。地中海航运有两条从巴西出发的主要航线,并将优化这些航线,为 USEC、USGC 和 USWC/ CA 提供服务。

请与您的客户代表联系,了解货运所受影响的详情。

北美船舶停留时间


标记图像

本周新闻

墨西哥海关系统故障导致跨境货运严重延误
墨西哥国家海关总署 (ANAM) 计算机系统持续出现一系列故障,严重扰乱了美国边境的货物运输,并造成港口和机场的延误。这些故障持续数日,影响了该机构以电子方式处理进出口文件的能力,促使墨西哥国家海关总署以 "应急 "模式运行。

即将签署的印太贸易协定为美国供应链的优先事项增添了新的内容
印度-太平洋繁荣经济框架(IPEF)供应链协议将于2月24日生效,以加强太平洋贸易国之间的供应链弹性。该协议由美国、澳大利亚和日本等伙伴国签署,强调数据共享、港口附近的仓储以及政策最佳实践方面的合作,以建立具有弹性和包容性的供应链。

尽管前景黯淡,1 月份进口仍创下 7 年来最快增速
尽管地缘政治局势紧张,苏伊士运河和巴拿马运河面临挑战,但根据笛卡尔公司的数据,1月份美国进口出人意料地激增,比12月份增长7.9%,同比增长9.9%。中国农历新年前的进口热潮推动了这一增长,西海岸港口受益最大,长滩和洛杉矶的进口量大幅增加。


来源于 Flexport.com

Freight Market Update: February 7, 2024

值得关注的趋势

[航空 - 全球](数据来源:World ACD/Accenture)

  • 2024 年 1 月 1 日至 28 日,全球国际航空货运能力比 2019 年增长了 10%。
  • 在过去四周里,全球国际航空货运能力比前四周下降了 4%。
  • 预计今年春节前后中国大陆和香港的航空货运量将下降 30%-40%,与往年持平。
  • 尽管 2024 年 1 月的平均收益率仍低于 2023 年 1 月,但由于红海危机和农历新年的预期,跨太平洋和亚欧航线的收益率在 1 月的最后几周有所上升。
  • 近几个月来,航空货运量持续上升,主要原因是自去年第四季度以来,亚太地区的电子商务活动强劲,同时,由于最近红海集装箱航运业务受到干扰,一些货物明显从海运转向空运和海空联运。

[美国出口]

  • 内陆铁路货场和出口装货点的设备数量减少,或越来越少。建议客户在货物备妥日期(CRD)前 3-4 周进行预订。如果无法做到这一点,可考虑用卡车和转运方式在沿海港口装货,以避免持续的设备问题。

[Ocean - FEWB]

  • 亚洲-北欧:红海危机继续影响货运市场的发展。达飞轮船公司因安全风险再次暂停红海转运,直至另行通知。
  • 由于返回亚洲的船只延误,农历新年出发前的设备越来越紧张。大多数承运商正在安排集装箱重新定位,以便按计划运输货物。我们强烈建议托运人采取灵活态度,接受集装箱替换,以避免进一步延误,并尽早安排空箱提货。承运商正在提供更长的起运时间,以减轻农历新年的影响。
  • 预计二月下半月的需求将保持平稳。承运商正在进一步下调运价,以迎合二月上半月的新货需求,为二月下半月的滚装船做准备。尽管已经宣布了大量的空船计划(WK08/09 平均削减 30%),但海洋联盟又宣布了 7 个空船计划,其中 3 个计划在 2 月启航,其余在 3 月启航。我们预计其他两个联盟也将很快公布更多的空置计划。
  • 为减轻运营挑战(船期调整、船舶缩减、设备短缺、滚装等)带来的干扰,托运人可以探索班轮公司以较高成本提供的溢价服务,以获得有保障的舱位和设备,缩短延误时间。
  • 亚洲-地中海:继北欧之后,地中海的浮动运价仍然偏高。从第 06 周开始,浮动运价呈小幅下降趋势,原因是要在农历新年前让更多的货物装满船,同时,由于亚洲需求疲软和假期,也要为 2 月下半月以后的滚装做准备。

请与您的客户代表联系,了解货运所受影响的详情。

北美船舶停留时间


标记图像

本周新闻

美国银行第四季度货运支付指数显示年度货运装运和支出下降
美国银行第四季度货运支付指数显示,货运支付和支出均有所下降,其中装运指数比第三季度下降10.9%,年降幅为15.7%,创下该指数自2017年推出以来的最大降幅。从地区来看,东南部、东北部和西部地区的年度装运量降幅最大。

弗吉尼亚港 12 月份货运量下降 2
12 月份,弗吉尼亚港的集装箱吞吐量同比下降 2%,为 268,107 个标准箱,这是港口货运量连续第十一个月下降。尽管近期货量有所下滑,但与疫情爆发前相比,集装箱吞吐量仍增长了 19%,这表明尽管 2023 年经历了低迷,但长期来看货量仍有所增长。

调查发现,零售商计划在 2024 年改变现状
卡尔-马克斯顾问公司(Carl Marks Advisors)的一项最新调查显示,中端市场零售和消费品包装公司正计划改变其供应链战略。这项调查涉及 250 家年收入在 2500 万美元至 3 亿美元之间的中端市场零售和消费包装品公司的高管。


来源于 Flexport.com

Freight Market Update: February 1, 2024

值得关注的趋势

[空气 - 全球](数据来源:WorldACD)

  • 一月份的全球航空货运需求与去年同期相比有显著增长。除北美以外,全球所有主要地区的货运需求都出现了增长。
  • 由于红海的干扰,一些货主正在将亚欧货物从海运转为空运或海空联运(如空运转海运)。这种转变,再加上 2024 年农历新年(2 月 10 日)较晚的影响和 1 月中旬的典型季节性趋势,促成了航空货运需求的增长。
  • 尽管国际集装箱航运受到严重干扰,亚洲至欧洲的海运即期费率上涨了两倍,但全球航空货运费率仍保持相对稳定。然而,由于季节性和与产品相关的需求因素,亚太地区以外的航空货运费率在 2023 年底已经上涨。
  • 由于空运预订窗口将在农历新年前关闭,货运代理公司正准备迎接未来几周的挑战,包括港口延误和欧洲货物堆积。这种情况可能会导致对空运货物的依赖增加。
  • 2024 年第 2 周和第 3 周与去年同期相比,全球总体需求增长了 6%,其中中东和南亚、非洲以及亚太地区的需求增长显著。全球平均运价比去年低 22%,但仍高于 COVID 前的水平。航空货运能力也同比大幅增长。

[印度次大陆至北美--大洋]

  • 进入二月上半月,海运费继续上涨,因为红海的干扰没有缓解的迹象。由于船只在好望角附近改道,造成运力短缺,这些船只被推迟抵达目的地,然后再返回原籍地。这种短期干扰预计将更具挑战性,而我们预计长期来看会趋于正常。
  • 集装箱短缺是承运人特有的问题,但最近许多主要湿港和内陆集装箱堆场报告的设备问题有所增加。
  • 有几项服务更新需要报告,其中包括地中海航运取消了 INDUSA(印度 → USEC)航线,导致其剩余的 INDUS EXPRESS 航线运力紧张。地中海航运还取消了 12 月底刚刚开通的直达巴基斯坦卡拉奇港的航线。OOCL/COSCO 取消了 AWES/ISE 服务(蒙德拉→波士顿/纽约/佛罗里达),原因是好望角改道导致运营成本增加。取消该航线后,从印度到波士顿不再有直达航线。

[TAWB – Ocean]

  • 需求保持稳定,预计 2 月份不会出现高峰。承运商仍在根据红海的最新进展管理运力。我们预计运力将平均下降 15-20%。
  • 由于与红海有关的几项附加费用将于 2 月 1 日生效,预计 2 月份的运价将会上涨。预计未来几周的指数也将如此。
  • 欧洲(主要是德国和东欧各地)的设备状况正在趋紧。这是红海局势导致转运时间增加的直接后果。
  • 准点率从 2023 年 7 月的 72%降至 2023 年 12 月的 50%(根据 Sea Intelligence 数据)。这在冬季是很正常的,因为这主要是由与天气有关的问题造成的。

[FEWB – Ocean]

  • 红海危机继续影响货运市场的发展。返回亚洲的船只继续面临延误。此外,承运商已经开始宣布中国南方以外的港口和亚洲的一些出港港口缺乏可用设备。托运人应保持灵活性,接受集装箱替换,以避免进一步延误。随着农历新年的临近,2 月下半月的需求依然平淡。因此,承运商正在调整费率,以迎合 2 月上半月的新货需求,并为 2 月下半月的滚装池填满船只做好准备,尽管有大量空箱计划(第 8 周和第 9 周预计平均下降 30%)。为减轻运营挑战(船期调整、船舶缩编、设备短缺、滚装等)带来的干扰,托运人应探索成本较高的班轮公司提供的优质服务。这种方法有助于保证舱位和设备,缩短延误时间。
  • 另一条新闻是,虽然德国铁路罢工已于 1 月 29 日结束,但德国农民目前正在举行抗议活动,他们阻止铁路工人进入主要港口,这对公路运输和进出口造成了影响。
  • 继北欧之后,地中海浮动运价尽管从第 6 周起略有下降趋势,但仍保持在较高水平,以便在农历新年前装满船。此外,由于需求疲软和亚洲的假期,现在预计将在 2 月下半月开始进行滚装池准备工作。

北美船舶停留时间

标记图像

本周新闻

拥挤的港口窒息了供应链
2024 年 1 月,洛杉矶港和长滩港拥堵加剧,威胁美国经济。ITS 物流公司的美国港口/铁路匝道货运指数显示,由于农历新年的补货,加上为避免苏伊士运河危机而改道的货运,跨太平洋货运量激增。

尽管欧盟排放交易计划已经生效,但并非所有船东都能进行欧盟协议贸易
欧盟排放交易体系(ETS)本月的实施给船东带来了挑战,许多船东尚未为新的排放法规做好准备。在欧盟排放交易体系下,船东必须根据其船舶在欧盟港口的碳排放量支付相应的欧盟配额(EUAs),这凸显了排放数据核查的必要性,以确保年度报告的准确性。

FTR 托运人条件指数创六月以来最高水平
据货运咨询公司FTR称,反映市场对托运人运输环境影响的托运人条件指数(SCI)在11月份达到了6.3的稳定读数。SCI 将高于零的读数视为对托运人有利,在柴油价格下降的推动下,SCI 显示了自 2023 年 6 月以来最有利的市场条件。

来源于 Flexport.com

Freight Market Update: January 24, 2024

值得关注的趋势

  • [航空 - 全球]2024 年初,航空货运量出现反弹,超过了往年的趋势。2024 年 1 月的第二周,全球航空货运量出现强劲反弹,与前一周相比增长了 24%,一反年末典型的放缓趋势。与去年同期相比,这一反弹趋势更为明显,从亚太地区、中东和南亚地区运往欧洲的货物明显增加,这可能是受到红海航运中断的影响。尽管与前两周相比,全球货运量总体下降了 7%,但中东和南亚的货运量上升了 2%,而主要洲际航线的货运量则大幅下降。同比数据显示,尽管运价仍比去年同期低 24%,但比 COVID 前的水平高出 31%,全球需求增长了 2%,其中亚太地区以外的需求显著增长了 6%。从亚太地区、中东和南亚地区到欧洲的货运量增加并没有导致平均价格的上涨,这表明全球航空货运市场的需求、运力和价格之间存在着复杂的相互作用。
  • [FEWB - Ocean] 亚洲-北欧:红海危机持续影响货运市场的发展。运价仍然偏高。过去几周,需求强劲,随着农历新年的临近,亚洲需求放缓,海运承运商纷纷降低运价。承运商又宣布了两项空船计划,导致 08/09 年 WK 的运力平均削减了 25% 以上。由于船只改道好望角,船只和集装箱面临更长的运输时间。预计未来几周亚洲将出现空箱短缺,尤其是外港。为减轻运营挑战(船期调整、船舶缩编、设备短缺、滚装等)带来的干扰,托运人可以探索班轮公司提供的成本较高的溢价服务,以获得有保障的空间和设备,缩短延误时间。德国铁路罢工:DB InfraGO AG 的德国铁路基础设施再次发生罢工。从欧洲中部时间 2024 年 1 月 23 日下午 6:00 至 2024 年 1 月 29 日,德国基础设施的所有交通都将受到影响。罢工将于欧洲中部时间 2024 年 1 月 29 日下午 6:00 结束。请密切关注事态发展,并做好运输计划(如有)。亚洲-地中海:继北欧之后,地中海浮动汇率仍然偏高。由于亚洲需求疲软和假期,WK04 的运价开始小幅走低,以推动更多货物在农历新年前装满船只,并为 WK07 以后的滚装船做准备。

北美船舶停留时间


标记图像

本周新闻

西海岸跨太平洋航班量将增加
ITS 物流公司的美国港口/铁路匝道货运指数报告显示,由于农历新年的季节性补货以及东海岸港口的潜在拥堵,美国西海岸的跨太平洋货运量有所增加。随着更多货物被运往西海岸,预计美国各地的铁路匝道将出现拥堵,从而影响远洋承运商合同季节的长期合同运价和运力。

标普全球报告:12 月美国进口增长,2023 年全年下降
2023 年 12 月,美国的集装箱货运进口量连续第四个月实现增长,增幅为 9%,达到 220 万 TEU(二十英尺标准箱)。这标志着在连续 14 个月的年度下降后出现了复苏。标准普尔全球信息公司指出,12 月份各行业普遍增长。

新数据显示,2023 年与 2022 年相比,货物盗窃案激增了 57% 以上
根据 CargoNet 的数据,2023 年的货物盗窃事件比上一年增加了 57% 以上,达到了前所未有的水平。报告的货物盗窃总额接近 1.3 亿美元,但由于报告的非强制性,实际数字可能更高。

来源于 Flexport.com

Freight Market Update: January 17, 2024

值得关注的趋势

  • [TAWB - Ocean]一月份的市场需求保持相对稳定,预计最早要到三月份才会出现高峰。虽然船舶总满载率仍未达到 100%,但由于冬季空航计划和一些承运商削减运力的直接影响,满载率略有上升。尽管由于空航,预计 1 月和 2 月的平均运力将下降 20%,但总体运力仍然很高。我们预计,未来几周承运商将增加运力,以帮助应对红海局势。我们已经看到海洋联盟和 2M 成员(马士基和地中海航运)在这样做。受红海局势的直接影响,跨大西洋航线的船舶运价已经开始上涨,预计在二月份大多数承运商宣布收取 GRI/PSS 和紧急附加费时,运价还会进一步上涨。其他消息方面,据几家航运公司报告,设备短缺已开始影响奥地利和德国南部的一些地区。全面的影响可能要到稍后阶段才会显现,而且还将取决于当前德国铁路状况的结果。
  • [FEWB - Ocean] 亚洲-北欧:1 月下半月的市场需求正在上升,所有船舶都已满载,未来几周承运商的滚装船库将会陆续开张。第 3 周的即期运价因农历新年高峰而略有上涨,第 4 周的即期运价稳定在农历新年前的高位。由于红海危机仍在继续,目前估计一艘船需要 2-4 周(往返),具体取决于目的地。受此直接影响,海洋联盟和 2M 公司宣布 2 月份将有 15 个以上的空船计划,预计 THE Alliance 不久还将宣布更多空船计划。如果情况保持不变,预计未来几周将出现设备短缺。德国罢工:罢工于 1 月 12 日结束,但未达成协议。我们预计将会有新一轮的罢工。预计不会产生直接影响。双子座合作:马士基和赫伯罗特宣布将于 2025 年 1 月开始正式合作。更多关于其他承运商的行动将陆续公布。
  • [地中海贸易]继北欧之后,地中海 1 月下半月第 3 周的即期运价正在上涨。第四周的即期运价预计将略有下降,因为承运人正在推动货物在农历新年前装满船只。
  • [美国出口]随着红海局势的持续,美国出口商在全球范围内发货时可能会因集装箱错位而造成设备短缺。我们强烈建议提前 4 周以上预订货物,以确保能够获得预期数量 (EQ)。
  • [航空 - 全球]继 12 月下半月的典型下滑之后,2024 年第一周全球航空货运吨位继续下降。第一周的初步数据显示,全球航空货运吨位周环比下降了 6%,尤其是从亚太地区到北美、中东和南亚以及亚太地区内部的货运量下降明显。今年第一周货运量的下降与 2023 年同期的稳定形成了鲜明对比,这可能是受今年第一周计算中包含 1 月 1 日假期的影响。在两周比较的基础上,2023 年最后两周和 2024 年第一周的总吨位下降了 28%,平均运价下降了 5%,运力下降了 8%。尽管出现了这些下降,但根据世界货运代理公司(World ACD)的数据,同期全球货运量同比增长了约 3%,目前全球平均运价比去年低 19%,但仍比 COVID 前的水平高出 30%。

北美船舶停留时间


标记图像

本周新闻

集装箱短缺加剧成本压力
全球集装箱短缺正在造成航运中断,特别是在红海地区,导致航线调整、延误和取消。尽管早有预测,但整个行业都感受到了这种影响,在中国主要港口很难买到 40 英尺高箱和 20 英尺通用集装箱。货运代理也报告了类似的问题,担心这些短缺会导致成本上升,尤其是在中国,这表明 2024 年从亚洲到欧洲的出境航段可能会出现动荡。

中国出口的变化表明与美国经济的联系正在破裂
去年,中国向东南亚出口的商品明显多于向美国出口的商品,这表明在经济关系紧张的情况下,全球贸易模式发生了变化。中国海关总署的数据显示,东盟十国购买了 5 240 亿美元的商品,超过了卖给美国的 5 000 亿美元。虽然这表明中美之间正在逐渐分离,但情况却很复杂。中国对墨西哥的出口增加了 5%以上,这可能是为了避免美国的关税。对泰国和越南的出口降幅也小于其他地区,这反映了将货物运往那里进行加工和再出口的趋势。

休斯顿港 11 月份货运量同比下降 15
11 月份,休斯顿港货物吞吐量同比下降 15%,为 297,622 个标准箱,但空箱量减少了 34%。与上月相比,货物处理量下降了 19%,但与疫情前的水平相比,集装箱处理总量增加了 21%。尽管发生了这些变化,休斯顿港还是迎来了达飞轮船公司的 Lisa Marie 号货轮,这是休斯顿港最大的货轮之一,可装载近 11,000 个标准箱。港口正在为增长进行战略规划,扩建休斯顿航道以容纳更大的船只,并增加集装箱码头的码头和堆场容量,以支持区域增长。

来源于 Flexport.com